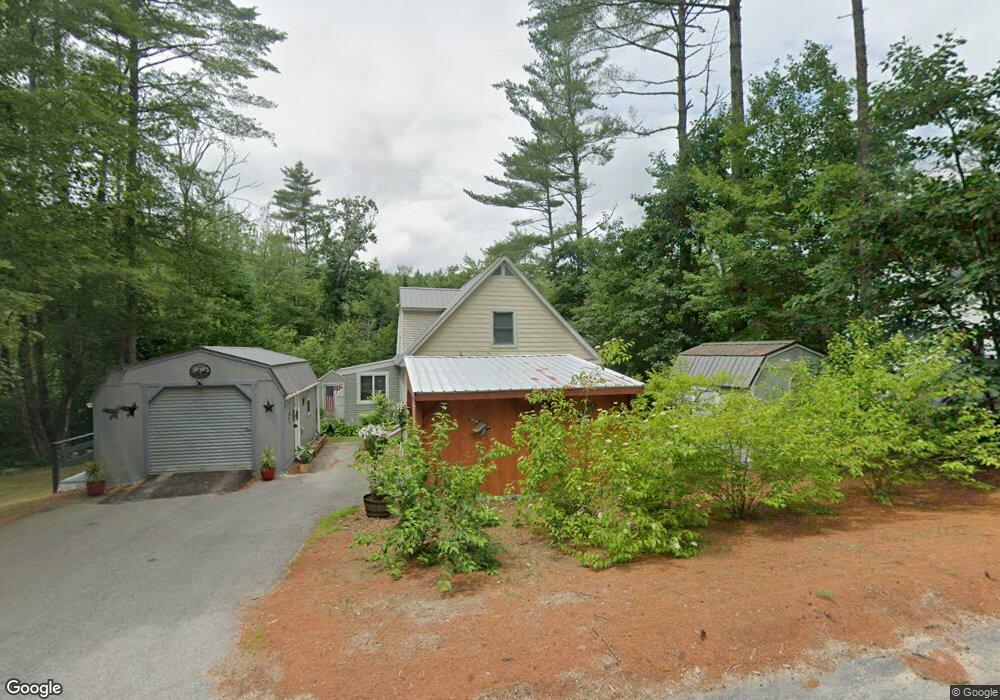
69 Tabor Cir Albany, NH 03818
Estimated Value: $255,000 - $365,741
3
Beds
2
Baths
1,202
Sq Ft
$266/Sq Ft
Est. Value
About This Home
This home is located at 69 Tabor Cir, Albany, NH 03818 and is currently estimated at $319,935, approximately $266 per square foot. 69 Tabor Cir is a home located in Carroll County with nearby schools including Robert Frost Charter School and Cady Memorial School.
Ownership History
Date
Name
Owned For
Owner Type
Purchase Details
Closed on
Oct 30, 2009
Sold by
Usa Rhs
Bought by
Ashnault Timothy D
Current Estimated Value
Home Financials for this Owner
Home Financials are based on the most recent Mortgage that was taken out on this home.
Original Mortgage
$63,920
Interest Rate
5.06%
Mortgage Type
Purchase Money Mortgage
Purchase Details
Closed on
Oct 27, 2009
Sold by
Bean Padraic R
Bought by
Usa Rhs
Home Financials for this Owner
Home Financials are based on the most recent Mortgage that was taken out on this home.
Original Mortgage
$63,920
Interest Rate
5.06%
Mortgage Type
Purchase Money Mortgage
Purchase Details
Closed on
Dec 12, 2005
Sold by
Lynde Lisa
Bought by
Bean Padraic and Bean Jennifer
Home Financials for this Owner
Home Financials are based on the most recent Mortgage that was taken out on this home.
Original Mortgage
$173,790
Interest Rate
6.17%
Mortgage Type
Purchase Money Mortgage
Create a Home Valuation Report for This Property
The Home Valuation Report is an in-depth analysis detailing your home's value as well as a comparison with similar homes in the area
Home Values in the Area
Average Home Value in this Area
Purchase History
| Date | Buyer | Sale Price | Title Company |
|---|---|---|---|
| Ashnault Timothy D | $79,900 | -- | |
| Usa Rhs | $77,500 | -- | |
| Bean Padraic | $169,000 | -- |
Source: Public Records
Mortgage History
| Date | Status | Borrower | Loan Amount |
|---|---|---|---|
| Open | Bean Padraic | $83,159 | |
| Closed | Bean Padraic | $63,920 | |
| Previous Owner | Bean Padraic | $173,790 |
Source: Public Records
Tax History Compared to Growth
Tax History
| Year | Tax Paid | Tax Assessment Tax Assessment Total Assessment is a certain percentage of the fair market value that is determined by local assessors to be the total taxable value of land and additions on the property. | Land | Improvement |
|---|---|---|---|---|
| 2024 | $1,514 | $165,600 | $50,800 | $114,800 |
| 2023 | $1,669 | $165,600 | $50,800 | $114,800 |
| 2022 | $1,805 | $165,600 | $50,800 | $114,800 |
| 2021 | $2,053 | $165,600 | $50,800 | $114,800 |
| 2020 | $1,995 | $165,600 | $50,800 | $114,800 |
| 2019 | $1,748 | $125,100 | $33,300 | $91,800 |
| 2018 | $1,858 | $125,100 | $33,300 | $91,800 |
| 2017 | $2,117 | $125,100 | $33,300 | $91,800 |
| 2016 | $1,564 | $125,100 | $33,300 | $91,800 |
| 2015 | $1,470 | $125,100 | $33,300 | $91,800 |
| 2014 | $1,585 | $124,100 | $33,300 | $90,800 |
| 2013 | $1,478 | $124,100 | $33,300 | $90,800 |
Source: Public Records
Map
Nearby Homes
- 7 Wildwood Rd
- 143 Holly Ridge Ln
- 15 Klausen Rd
- 106 Fairview Ave
- 8 Grimsel Rd
- lots42,43,44,49 G St
- 19 Easy Ave
- 40 Butternut Ln
- 369 Tasker Hill Rd
- 46 Huttwill Dr
- 149 Allard Hill Rd
- 19 W Bergamo Rd
- 6 Main St
- 237 Eaton Rd
- 20 Washington St
- 58 Wilder St
- 26 Saint Moritz Dr
- 00 Moat View Dr Unit 167
- 00 Moat View Dr Unit 166
- 123 Oxbow Ln