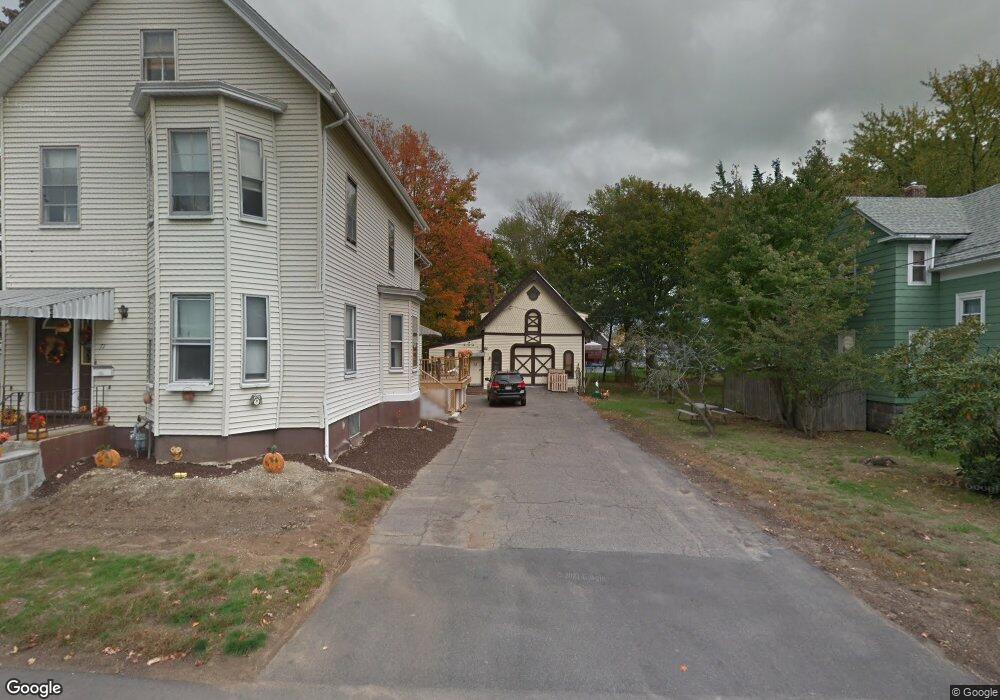
69 Tremont St Unit 71 Braintree, MA 02184
South Braintree NeighborhoodEstimated Value: $697,000 - $1,109,719
6
Beds
2
Baths
2,541
Sq Ft
$365/Sq Ft
Est. Value
About This Home
This home is located at 69 Tremont St Unit 71, Braintree, MA 02184 and is currently estimated at $927,180, approximately $364 per square foot. 69 Tremont St Unit 71 is a home located in Norfolk County with nearby schools including Braintree High School, Meeting House Montessori School, and Thayer Academy.
Ownership History
Date
Name
Owned For
Owner Type
Purchase Details
Closed on
Apr 25, 2019
Sold by
Levangie Damian F Est
Bought by
Nguyen An C and Vu Nhung
Current Estimated Value
Home Financials for this Owner
Home Financials are based on the most recent Mortgage that was taken out on this home.
Original Mortgage
$352,000
Outstanding Balance
$309,471
Interest Rate
4.3%
Mortgage Type
New Conventional
Estimated Equity
$617,709
Create a Home Valuation Report for This Property
The Home Valuation Report is an in-depth analysis detailing your home's value as well as a comparison with similar homes in the area
Home Values in the Area
Average Home Value in this Area
Purchase History
| Date | Buyer | Sale Price | Title Company |
|---|---|---|---|
| Nguyen An C | $440,000 | -- |
Source: Public Records
Mortgage History
| Date | Status | Borrower | Loan Amount |
|---|---|---|---|
| Open | Nguyen An C | $352,000 |
Source: Public Records
Tax History Compared to Growth
Tax History
| Year | Tax Paid | Tax Assessment Tax Assessment Total Assessment is a certain percentage of the fair market value that is determined by local assessors to be the total taxable value of land and additions on the property. | Land | Improvement |
|---|---|---|---|---|
| 2025 | $9,497 | $951,600 | $373,300 | $578,300 |
| 2024 | $8,245 | $869,700 | $348,100 | $521,600 |
| 2023 | $7,782 | $797,300 | $312,800 | $484,500 |
| 2022 | $7,632 | $767,000 | $282,500 | $484,500 |
| 2021 | $6,868 | $690,300 | $255,300 | $435,000 |
| 2020 | $5,116 | $518,900 | $232,100 | $286,800 |
| 2019 | $5,351 | $530,300 | $222,000 | $308,300 |
| 2018 | $5,235 | $496,700 | $201,800 | $294,900 |
| 2017 | $5,226 | $486,600 | $191,700 | $294,900 |
| 2016 | $4,500 | $409,800 | $161,400 | $248,400 |
| 2015 | $4,514 | $407,800 | $159,400 | $248,400 |
| 2014 | $4,147 | $363,100 | $145,300 | $217,800 |
Source: Public Records
Map
Nearby Homes
- 6 Franklin St
- 305 Franklin St
- 7 Carter Rd
- 414 John Mahar Hwy Unit 402
- 418 John Mahar Hwy Unit 408
- 6 Oak St
- 428 John Mahar Hwy Unit 301
- 37 Monatiquot Ave
- 491 Washington St Unit 1
- 61 Grove St
- 605 Middle St Unit 38
- 80 Lake St
- 78 Windemere Cir
- 72 Armstrong Cir
- 47 Addison St
- 256 Evergreen Ave
- 184 Richard Rd
- 117 Amherst Rd
- 298 Lisle St
- 115 Richard Rd
- 71 Tremont St
- 75 Tremont St
- 75 Tremont St
- 50 Taylor St
- 50 Taylor St Unit 50
- 47 Tremont St Unit 2nd
- 61 Tremont St
- 59 Tremont St Unit 61
- 59 Tremont St Unit 1
- 42 Taylor St
- 42 Taylor St Unit 2
- 42 Taylor St Unit 1
- 57 Tremont St Unit 57
- 55 Tremont St Unit 57
- 70 Tremont St Unit 2L
- 70 Tremont St Unit 2R
- 70 Tremont St Unit 4
- 24 Central St
- 36 Taylor St
- 64 Tremont St