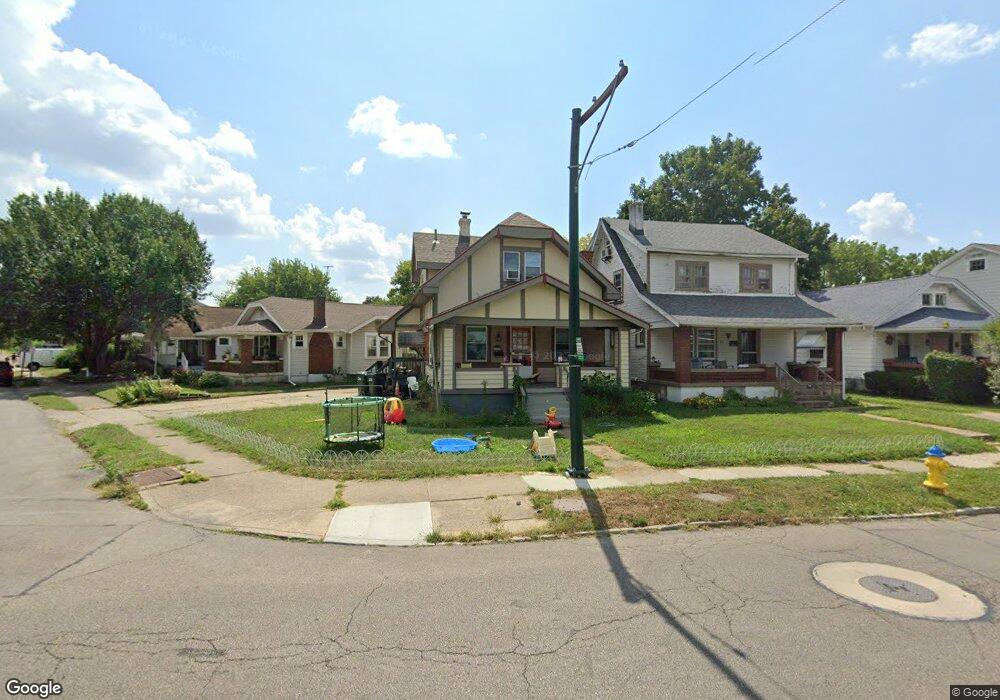
69 Watervliet Ave Dayton, OH 45420
Belmont NeighborhoodEstimated Value: $136,000 - $177,000
3
Beds
2
Baths
1,101
Sq Ft
$150/Sq Ft
Est. Value
About This Home
This home is located at 69 Watervliet Ave, Dayton, OH 45420 and is currently estimated at $165,456, approximately $150 per square foot. 69 Watervliet Ave is a home located in Montgomery County with nearby schools including Cleveland Elementary School, Horace Mann Elementary School, and Eastmont Elementary.
Ownership History
Date
Name
Owned For
Owner Type
Purchase Details
Closed on
Mar 26, 2021
Sold by
Turnkey Cashflow Llc
Bought by
Hong Hyun Sook
Current Estimated Value
Home Financials for this Owner
Home Financials are based on the most recent Mortgage that was taken out on this home.
Original Mortgage
$89,925
Outstanding Balance
$81,060
Interest Rate
2.9%
Mortgage Type
New Conventional
Estimated Equity
$84,396
Purchase Details
Closed on
Jun 5, 2020
Sold by
Rose Rocky
Bought by
Turnkey Cashflow Llc
Home Financials for this Owner
Home Financials are based on the most recent Mortgage that was taken out on this home.
Original Mortgage
$83,900
Interest Rate
3.2%
Mortgage Type
Unknown
Purchase Details
Closed on
Oct 1, 2007
Sold by
Woolum Brenda and Hawley Raymond
Bought by
Rose Rocky
Purchase Details
Closed on
Aug 17, 2005
Sold by
Gelvin Rose E and Gelvin Troy D
Bought by
Woolum Brenda
Create a Home Valuation Report for This Property
The Home Valuation Report is an in-depth analysis detailing your home's value as well as a comparison with similar homes in the area
Home Values in the Area
Average Home Value in this Area
Purchase History
| Date | Buyer | Sale Price | Title Company |
|---|---|---|---|
| Hong Hyun Sook | $119,900 | All Points Title | |
| Turnkey Cashflow Llc | $45,000 | All Points Title | |
| Rose Rocky | -- | None Available | |
| Woolum Brenda | -- | -- |
Source: Public Records
Mortgage History
| Date | Status | Borrower | Loan Amount |
|---|---|---|---|
| Open | Hong Hyun Sook | $89,925 | |
| Previous Owner | Turnkey Cashflow Llc | $83,900 |
Source: Public Records
Tax History Compared to Growth
Tax History
| Year | Tax Paid | Tax Assessment Tax Assessment Total Assessment is a certain percentage of the fair market value that is determined by local assessors to be the total taxable value of land and additions on the property. | Land | Improvement |
|---|---|---|---|---|
| 2024 | $2,031 | $35,230 | $6,390 | $28,840 |
| 2023 | $2,031 | $35,230 | $6,390 | $28,840 |
| 2022 | $2,033 | $27,030 | $4,920 | $22,110 |
| 2021 | $2,022 | $27,030 | $4,920 | $22,110 |
| 2020 | $2,018 | $27,030 | $4,920 | $22,110 |
| 2019 | $2,011 | $24,950 | $4,920 | $20,030 |
| 2018 | $2,014 | $24,950 | $4,920 | $20,030 |
| 2017 | $1,998 | $24,950 | $4,920 | $20,030 |
| 2016 | $2,039 | $24,230 | $4,920 | $19,310 |
| 2015 | $1,929 | $24,230 | $4,920 | $19,310 |
| 2014 | $1,929 | $24,230 | $4,920 | $19,310 |
| 2012 | -- | $22,710 | $4,930 | $17,780 |
Source: Public Records
Map
Nearby Homes
- 56 Watervliet Ave
- 2212 Brookline Ave
- 3221 Wayne Ave
- 2225 King Ave
- 3136 Hassler St
- 3143 Hassler St
- 2039 Pershing Blvd
- 2229 Nill Ave
- 2266 King Ave
- 3125 Cottage Terrace
- 2242 Nill Ave
- 1311 Pursell Ave
- 3605 Woodbine Ave
- 3140 Taggart St
- 1300 Carlisle Ave
- 3618 Woodbine Ave
- 2600 Wayne Ave
- 1414 Phillips Ave
- 3704 Wayne Ave
- 1230 Pursell Ave
- 2107 Revere Ave
- 65 Watervliet Ave
- 61 Watervliet Ave
- 2111 Revere Ave
- 57 Watervliet Ave
- 2115 Revere Ave
- 2037 Revere Ave
- 2119 Revere Ave
- 2120 Mapleview Ave
- 2122 Mapleview Ave
- 2126 Mapleview Ave
- 2130 Mapleview Ave
- 49 Watervliet Ave
- 51 Watervliet Ave
- 2123 Revere Ave
- 104 Watervliet Ave
- 115 Watervliet Ave
- 62 Watervliet Ave
- 2134 Mapleview Ave
- 2127 Revere Ave