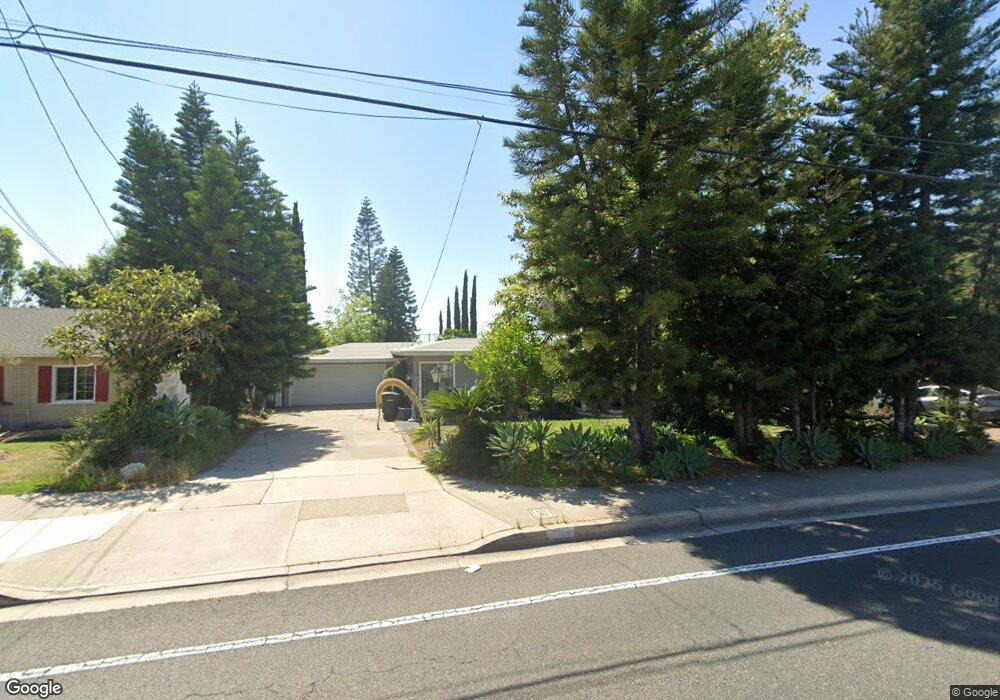
690 N Cambridge St Orange, CA 92867
Estimated Value: $1,041,730 - $1,206,000
2
Beds
1
Bath
1,616
Sq Ft
$696/Sq Ft
Est. Value
About This Home
This home is located at 690 N Cambridge St, Orange, CA 92867 and is currently estimated at $1,124,683, approximately $695 per square foot. 690 N Cambridge St is a home located in Orange County with nearby schools including Cambridge Elementary School, Yorba Middle School, and Orange High School.
Ownership History
Date
Name
Owned For
Owner Type
Purchase Details
Closed on
Jun 5, 1998
Sold by
Mofid Parven
Bought by
Mofid Ahmad
Current Estimated Value
Home Financials for this Owner
Home Financials are based on the most recent Mortgage that was taken out on this home.
Original Mortgage
$207,000
Outstanding Balance
$40,693
Interest Rate
7.17%
Estimated Equity
$1,083,990
Purchase Details
Closed on
May 11, 1998
Sold by
Busch Thomas A and Busch Rodger
Bought by
Ford Ahmad
Home Financials for this Owner
Home Financials are based on the most recent Mortgage that was taken out on this home.
Original Mortgage
$207,000
Outstanding Balance
$40,693
Interest Rate
7.17%
Estimated Equity
$1,083,990
Purchase Details
Closed on
Nov 13, 1996
Sold by
Busch Arthur E and Busch Lorna R
Bought by
Busch Lorna R and The Busch Family Trust
Create a Home Valuation Report for This Property
The Home Valuation Report is an in-depth analysis detailing your home's value as well as a comparison with similar homes in the area
Home Values in the Area
Average Home Value in this Area
Purchase History
| Date | Buyer | Sale Price | Title Company |
|---|---|---|---|
| Mofid Ahmad | -- | American Title Co | |
| Ford Ahmad | $230,000 | American Title Co | |
| Busch Lorna R | -- | -- |
Source: Public Records
Mortgage History
| Date | Status | Borrower | Loan Amount |
|---|---|---|---|
| Open | Ford Ahmad | $207,000 |
Source: Public Records
Tax History Compared to Growth
Tax History
| Year | Tax Paid | Tax Assessment Tax Assessment Total Assessment is a certain percentage of the fair market value that is determined by local assessors to be the total taxable value of land and additions on the property. | Land | Improvement |
|---|---|---|---|---|
| 2025 | $4,125 | $367,241 | $282,946 | $84,295 |
| 2024 | $4,125 | $360,041 | $277,398 | $82,643 |
| 2023 | $4,030 | $352,982 | $271,959 | $81,023 |
| 2022 | $3,949 | $346,061 | $266,626 | $79,435 |
| 2021 | $3,840 | $339,276 | $261,398 | $77,878 |
| 2020 | $3,804 | $335,798 | $258,718 | $77,080 |
| 2019 | $3,757 | $329,214 | $253,645 | $75,569 |
| 2018 | $3,699 | $322,759 | $248,671 | $74,088 |
| 2017 | $3,548 | $316,431 | $243,795 | $72,636 |
| 2016 | $3,480 | $310,227 | $239,015 | $71,212 |
| 2015 | $3,428 | $305,568 | $235,425 | $70,143 |
| 2014 | $3,353 | $299,583 | $230,814 | $68,769 |
Source: Public Records
Map
Nearby Homes
- 1040 E Oakmont Ave
- 1105 E Rose Ave
- 1241 E Mayfair Ave
- 1316 E Lomita Ave
- 337 E Everett Place
- 1144 E Madison Ave
- 1232 E Jacaranda Ave
- 994 N Cleveland St
- 982 N Shaffer St
- 145 W Mayfair Ave
- 1412 E Quincy Ave
- 280 N Cleveland St
- 316 N Shattuck Place
- 1801 E Collins Ave Unit 42
- 1801 E Collins Ave Unit 65
- 1801 E Collins Ave Unit 6
- 201 E Collins Ave Unit 134
- 201 W Collins Ave Unit 55
- 201 W Collins Ave Unit 40
- 201 W Collins Ave Unit 73
- 680 N Cambridge St
- 702 N Cambridge St Unit B
- 702 N Cambridge St Unit A
- 702 N Cambridge St
- 670 N Cambridge St
- 903 E Everett Place
- 720 N Cambridge St
- 904 E Mayfair Ave
- 913 E Everett Place
- 650 N Cambridge St
- 904 E Everett Place
- 916 E Mayfair Ave
- 923 E Everett Place
- 736 N Cambridge St
- 640 N Cambridge St
- 916 E Everett Place
- 926 E Mayfair Ave
- 933 E Everett Place
- 645 N Cambridge St
- 592 N Cambridge St