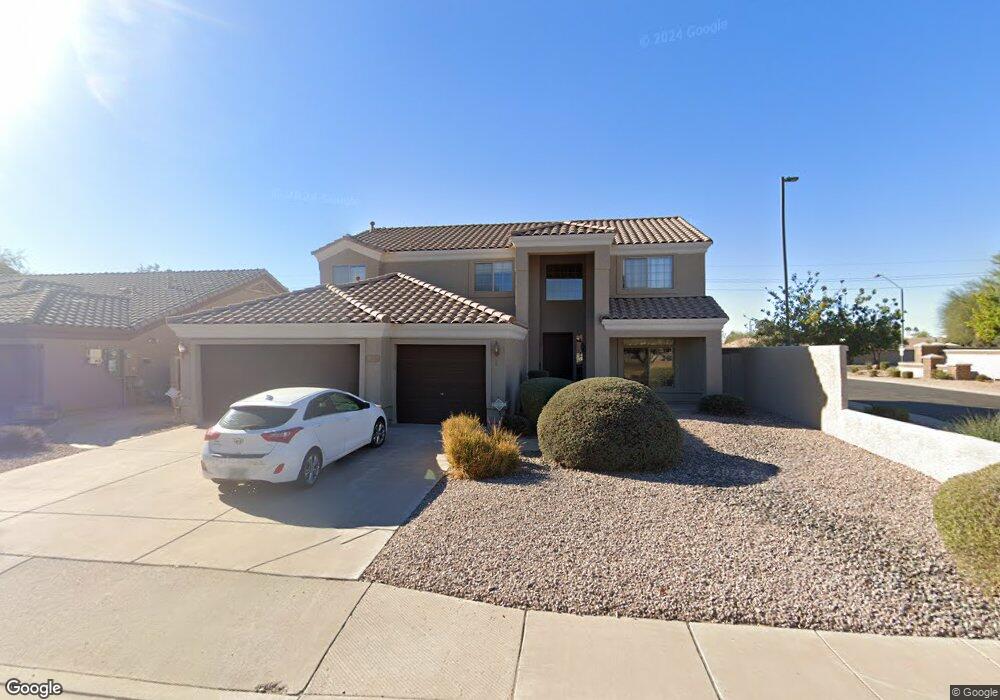
690 N Swallow Ln Gilbert, AZ 85234
Val Vista NeighborhoodEstimated Value: $632,817 - $725,000
--
Bed
4
Baths
3,080
Sq Ft
$223/Sq Ft
Est. Value
About This Home
This home is located at 690 N Swallow Ln, Gilbert, AZ 85234 and is currently estimated at $685,454, approximately $222 per square foot. 690 N Swallow Ln is a home located in Maricopa County with nearby schools including Towne Meadows Elementary School, Highland High School, and Highland Jr High School.
Ownership History
Date
Name
Owned For
Owner Type
Purchase Details
Closed on
Nov 17, 2012
Sold by
Warner Robert J and Warner Tamara A
Bought by
Warner Tamara A
Current Estimated Value
Purchase Details
Closed on
Apr 25, 2002
Sold by
Warner Robert J
Bought by
Warner Robert J and Warner Tamara A
Home Financials for this Owner
Home Financials are based on the most recent Mortgage that was taken out on this home.
Original Mortgage
$225,000
Outstanding Balance
$95,068
Interest Rate
7.08%
Estimated Equity
$590,386
Purchase Details
Closed on
Dec 21, 1998
Sold by
U S Home Corp
Bought by
Warner Robert J and Warner Cindy D
Home Financials for this Owner
Home Financials are based on the most recent Mortgage that was taken out on this home.
Original Mortgage
$171,000
Interest Rate
11.12%
Mortgage Type
New Conventional
Create a Home Valuation Report for This Property
The Home Valuation Report is an in-depth analysis detailing your home's value as well as a comparison with similar homes in the area
Home Values in the Area
Average Home Value in this Area
Purchase History
| Date | Buyer | Sale Price | Title Company |
|---|---|---|---|
| Warner Tamara A | -- | None Available | |
| Warner Robert J | -- | United Title Agency Inc | |
| Warner Robert J | $180,392 | Stewart Title & Trust |
Source: Public Records
Mortgage History
| Date | Status | Borrower | Loan Amount |
|---|---|---|---|
| Open | Warner Robert J | $225,000 | |
| Closed | Warner Robert J | $171,000 |
Source: Public Records
Tax History Compared to Growth
Tax History
| Year | Tax Paid | Tax Assessment Tax Assessment Total Assessment is a certain percentage of the fair market value that is determined by local assessors to be the total taxable value of land and additions on the property. | Land | Improvement |
|---|---|---|---|---|
| 2025 | $2,557 | $32,924 | -- | -- |
| 2024 | $2,476 | $31,356 | -- | -- |
| 2023 | $2,476 | $46,800 | $9,360 | $37,440 |
| 2022 | $2,400 | $34,880 | $6,970 | $27,910 |
| 2021 | $2,527 | $34,570 | $6,910 | $27,660 |
| 2020 | $2,486 | $32,410 | $6,480 | $25,930 |
| 2019 | $2,287 | $30,310 | $6,060 | $24,250 |
| 2018 | $2,221 | $28,830 | $5,760 | $23,070 |
| 2017 | $2,144 | $27,770 | $5,550 | $22,220 |
| 2016 | $2,219 | $26,120 | $5,220 | $20,900 |
| 2015 | $2,021 | $24,300 | $4,860 | $19,440 |
Source: Public Records
Map
Nearby Homes
- 631 N Sabino Dr
- 3871 E Pinon Ct
- 3861 E Pinon Ct
- 4070 E Orion St
- 4099 E Libra Ave
- 736 N Bridlegate Dr
- 3920 E Heather Ct
- 4041 E Libra Ave
- 4131 E Stanford Ave
- 3971 E Page Ave
- 4338 E Douglas Ave
- 4219 E San Remo Ave
- 4319 E Vaughn Ave
- 3851 E San Pedro Ave
- 4258 E Lexington Ave
- 4131 E Cullumber Ct
- 3918 E San Pedro Ave
- 3951 E Cullumber St
- 3885 E Cullumber St
- 907 N Falcon Dr
- 680 N Swallow Ln
- 670 N Swallow Ln
- 710 N Swallow Ln
- 660 N Swallow Ln
- 720 N Swallow Ln
- 4039 E Pinon Way
- 650 N Swallow Ln
- 730 N Swallow Ln
- 4049 E Pinon Way
- 685 N Joshua Tree Ln
- 693 N Joshua Tree Ln
- 677 N Joshua Tree Ln
- 701 N Joshua Tree Ln
- 669 N Joshua Tree Ln
- 709 N Joshua Tree Ln
- 4038 E Kroll Dr
- 4038 E Breckenridge Way
- 661 N Joshua Tree Ln
- 4059 E Pinon Way
- 640 N Swallow Ln