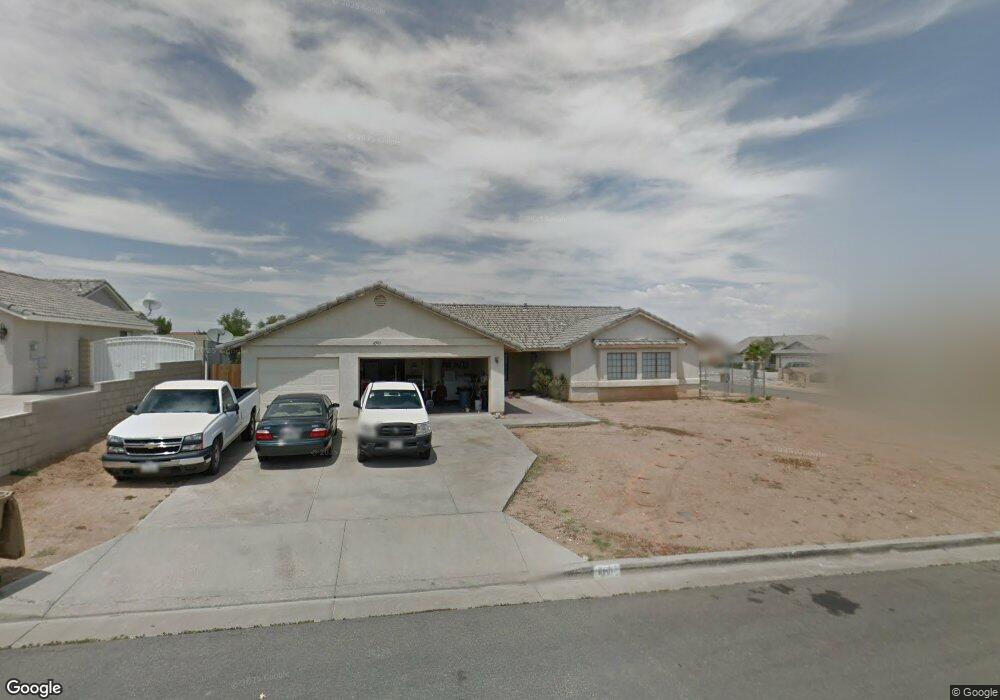
6901 Via Marbella St Hesperia, CA 92345
The Mesa NeighborhoodEstimated Value: $457,632 - $516,000
4
Beds
2
Baths
1,901
Sq Ft
$256/Sq Ft
Est. Value
About This Home
This home is located at 6901 Via Marbella St, Hesperia, CA 92345 and is currently estimated at $486,658, approximately $256 per square foot. 6901 Via Marbella St is a home located in San Bernardino County with nearby schools including Mesa Grande Elementary School, Cedar Middle School, and Oak Hills High School.
Ownership History
Date
Name
Owned For
Owner Type
Purchase Details
Closed on
Aug 19, 2009
Sold by
Deutsche Bank National Trust Company
Bought by
Marscheider David
Current Estimated Value
Home Financials for this Owner
Home Financials are based on the most recent Mortgage that was taken out on this home.
Original Mortgage
$132,554
Interest Rate
5.08%
Mortgage Type
FHA
Purchase Details
Closed on
Jul 10, 2009
Sold by
Perry Mark E and Perry Cindy
Bought by
Deutsche Bank National Trust Company
Home Financials for this Owner
Home Financials are based on the most recent Mortgage that was taken out on this home.
Original Mortgage
$132,554
Interest Rate
5.08%
Mortgage Type
FHA
Purchase Details
Closed on
Sep 21, 1993
Sold by
Rancho Verde I
Bought by
Perry Mark E and Perry Cindy
Home Financials for this Owner
Home Financials are based on the most recent Mortgage that was taken out on this home.
Original Mortgage
$135,818
Interest Rate
6.95%
Mortgage Type
FHA
Create a Home Valuation Report for This Property
The Home Valuation Report is an in-depth analysis detailing your home's value as well as a comparison with similar homes in the area
Home Values in the Area
Average Home Value in this Area
Purchase History
| Date | Buyer | Sale Price | Title Company |
|---|---|---|---|
| Marscheider David | $135,000 | Fidelity National Title | |
| Deutsche Bank National Trust Company | $89,250 | None Available | |
| Perry Mark E | $137,000 | Orange Coast Title |
Source: Public Records
Mortgage History
| Date | Status | Borrower | Loan Amount |
|---|---|---|---|
| Previous Owner | Marscheider David | $132,554 | |
| Previous Owner | Perry Mark E | $135,818 |
Source: Public Records
Tax History Compared to Growth
Tax History
| Year | Tax Paid | Tax Assessment Tax Assessment Total Assessment is a certain percentage of the fair market value that is determined by local assessors to be the total taxable value of land and additions on the property. | Land | Improvement |
|---|---|---|---|---|
| 2025 | $1,793 | $161,352 | $32,270 | $129,082 |
| 2024 | $1,793 | $158,188 | $31,637 | $126,551 |
| 2023 | $1,774 | $155,087 | $31,017 | $124,070 |
| 2022 | $1,734 | $152,046 | $30,409 | $121,637 |
| 2021 | $1,703 | $149,065 | $29,813 | $119,252 |
| 2020 | $1,683 | $147,536 | $29,507 | $118,029 |
| 2019 | $1,649 | $144,643 | $28,928 | $115,715 |
| 2018 | $1,618 | $141,807 | $28,361 | $113,446 |
| 2017 | $1,590 | $139,027 | $27,805 | $111,222 |
| 2016 | $1,557 | $136,301 | $27,260 | $109,041 |
| 2015 | $1,537 | $134,254 | $26,851 | $107,403 |
| 2014 | $1,517 | $131,624 | $26,325 | $105,299 |
Source: Public Records
Map
Nearby Homes
- 15790 Jenny St
- 0 Lurelane Ave
- 15815 Arbury St
- 6995 Summit Valley Rd
- 15345 Farmington St
- 0 Juniper Unit 25590291
- 0 Juniper St Unit IV25199725
- 0 Juniper St Unit CV25173548
- 0 Ortega St Unit OC25117108
- 0 Juniper St Unit HD25105019
- 0 Juniper Unit HD25037279
- 0 Juniper St Unit IV25032447
- 0 Juniper St Unit HD25029822
- 0 Carrissa Ave Unit HD24049636
- 0 Outer Bear Valley Rd Unit HD22221154
- 0 H St Unit HD22159747
- 15291 Wells Fargo St
- 5071 McConneny Rd
- 4151312 Hesperia Rd
- 0 Middleton Ave
- 6903 Via Marbella St
- 6907 Via Marbella St
- 6911 Via Marbella St
- 15663 Via Hermosa St
- 7007 Via Flores St
- 6991 Via Flores Hesperia
- 7015 Via Flores St
- 15651 Via Hermosa St
- 6904 Via Marbella St
- 7027 Via Flores St
- 15633 Via Hermosa St
- 6902 Via Marbella St
- 6991 Via Flores St
- 6906 Via Marbella St
- 6915 Via Marbella St
- 6900 Via Marbella St
- 15613 Via Hermosa St
- 7035 Via Flores St
- 6912 Via Marbella St
- 15599 Via Hermosa St