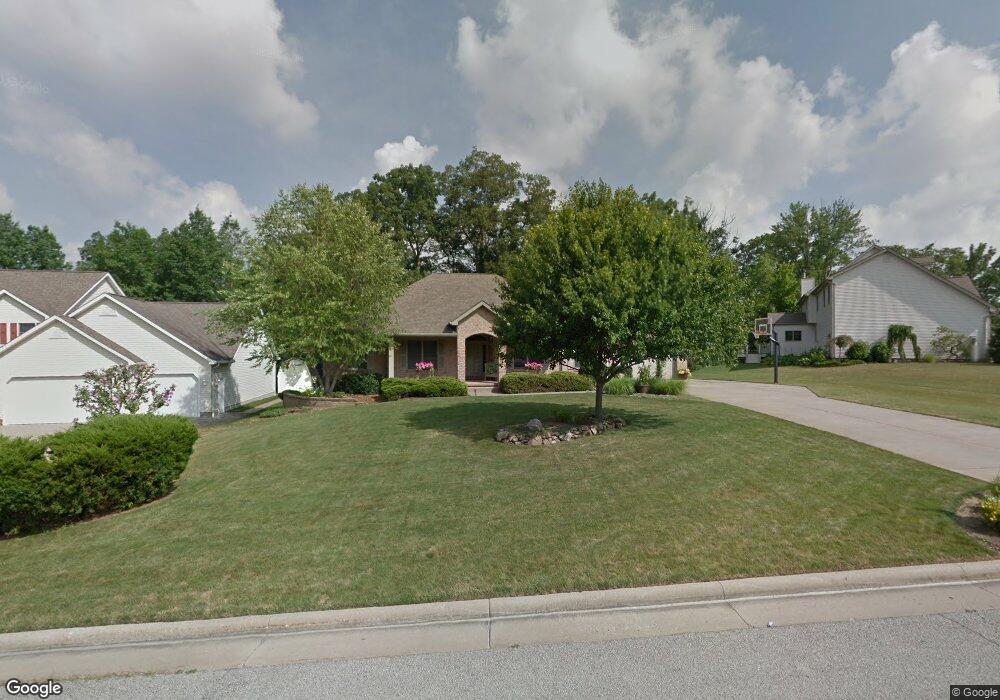
6905 Ruby Courts Youngstown, OH 44515
Austintown NeighborhoodEstimated Value: $362,000 - $447,000
3
Beds
3
Baths
2,301
Sq Ft
$169/Sq Ft
Est. Value
About This Home
This home is located at 6905 Ruby Courts, Youngstown, OH 44515 and is currently estimated at $387,811, approximately $168 per square foot. 6905 Ruby Courts is a home located in Mahoning County with nearby schools including Austintown Elementary School, Austintown Intermediate School, and Austintown Middle School.
Ownership History
Date
Name
Owned For
Owner Type
Purchase Details
Closed on
Aug 1, 2005
Current Estimated Value
Purchase Details
Closed on
Jun 7, 1999
Sold by
Hutchison Jack E and Hutchison Mary L
Create a Home Valuation Report for This Property
The Home Valuation Report is an in-depth analysis detailing your home's value as well as a comparison with similar homes in the area
Home Values in the Area
Average Home Value in this Area
Purchase History
| Date | Buyer | Sale Price | Title Company |
|---|---|---|---|
| -- | -- | -- | |
| -- | $44,500 | -- |
Source: Public Records
Tax History
| Year | Tax Paid | Tax Assessment Tax Assessment Total Assessment is a certain percentage of the fair market value that is determined by local assessors to be the total taxable value of land and additions on the property. | Land | Improvement |
|---|---|---|---|---|
| 2025 | $5,042 | $105,180 | $13,560 | $91,620 |
| 2024 | $4,812 | $105,180 | $13,560 | $91,620 |
| 2023 | $4,737 | $105,180 | $13,560 | $91,620 |
| 2022 | $4,600 | $81,900 | $13,560 | $68,340 |
| 2021 | $4,602 | $81,900 | $13,560 | $68,340 |
| 2020 | $4,622 | $81,900 | $13,560 | $68,340 |
| 2019 | $4,829 | $78,010 | $12,920 | $65,090 |
| 2018 | $4,646 | $78,010 | $12,920 | $65,090 |
| 2017 | $4,643 | $78,010 | $12,920 | $65,090 |
| 2016 | $4,494 | $74,770 | $12,050 | $62,720 |
| 2015 | $4,357 | $74,770 | $12,050 | $62,720 |
| 2014 | $4,377 | $74,770 | $12,050 | $62,720 |
| 2013 | $4,330 | $74,770 | $12,050 | $62,720 |
Source: Public Records
Map
Nearby Homes
- 6581 Country Ridge Ave
- 2998 Whispering Pines Dr
- 3013 Whispering Pines Dr
- 583 Wyndclift Cir
- 3121 Meanderwood Dr
- 3449 Meanderwood Dr
- 6270 Fairview Rd
- 6266 Fairview Rd
- 379 Wyndclift Place
- 242 Wilcox Rd Unit 242
- 6948 Meander Reserve Ct
- 0 Maple Ave Unit 5190079
- 0 Maple Ave Unit 5190077
- 0 Maple Ave Unit 5190082
- 9112 New Rd
- 370 Wilcox Rd
- 519 Wilcox Rd Unit A
- 69 N Turner Rd
- 6042 Callaway Cir Unit 5
- 100 Clearwater Cove S
- 6895 Ruby Courts
- 6935 Ruby Courts
- 6875 Ruby Courts
- 6995 Ruby Courts
- 6975 Ruby Ct
- 6894 Ruby Courts
- 7005 Ruby Courts
- 6884 Ruby Courts
- 6914 Ruby Courts
- 6874 Ruby Courts
- 7021 Ruby Courts
- 6924 Ruby Courts
- 6934 Ruby Courts
- 6944 Ruby Courts
- 7031 Ruby Courts
- 6954 Ruby Courts
- 6964 Ruby Ct
- 6854 Ruby Ct
- 6994 Ruby Courts
- 6984 Ruby Courts
Your Personal Tour Guide
Ask me questions while you tour the home.