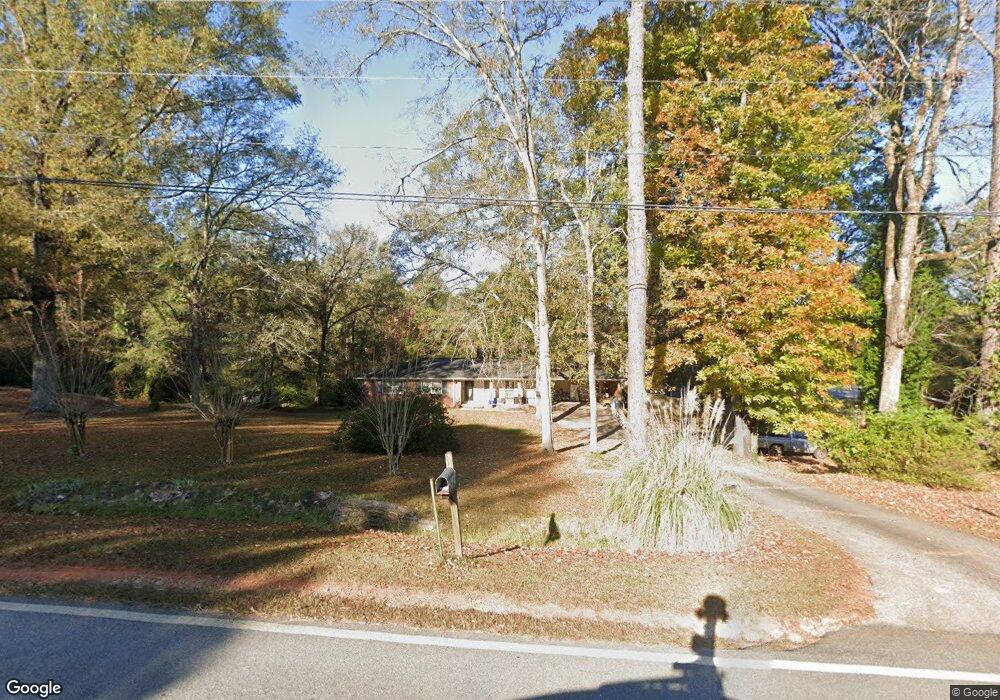
691 Whitaker Rd Lagrange, GA 30240
Estimated Value: $249,930 - $272,000
3
Beds
2
Baths
1,635
Sq Ft
$157/Sq Ft
Est. Value
About This Home
This home is located at 691 Whitaker Rd, Lagrange, GA 30240 and is currently estimated at $257,483, approximately $157 per square foot. 691 Whitaker Rd is a home located in Troup County with nearby schools including Hollis Hand Elementary School, Ethel W. Kight Elementary School, and Franklin Forest Elementary School.
Ownership History
Date
Name
Owned For
Owner Type
Purchase Details
Closed on
Dec 1, 2000
Sold by
Michael N Bennett
Bought by
Bennett Michael Neil and Bennett Ichelle
Current Estimated Value
Purchase Details
Closed on
Nov 30, 2000
Sold by
Johnson Charles C
Bought by
Michael N Bennett
Purchase Details
Closed on
Aug 11, 1998
Sold by
Joseph Roper and Joseph Linda
Bought by
Johnson Charles C
Purchase Details
Closed on
Jul 2, 1997
Sold by
Joseph D Roper Int
Bought by
Joseph Roper and Joseph Linda
Purchase Details
Closed on
Oct 15, 1973
Sold by
Whitaker Charlie R
Bought by
Joseph D Roper Int
Purchase Details
Closed on
Jan 1, 1973
Sold by
Copeland Wayne B
Bought by
Whitaker Charlie R
Purchase Details
Closed on
Jan 1, 1972
Sold by
Whitaker Charlie R
Bought by
Copeland Wayne B
Purchase Details
Closed on
Mar 1, 1946
Sold by
Whitaker B F
Bought by
Whitaker Charlie R
Create a Home Valuation Report for This Property
The Home Valuation Report is an in-depth analysis detailing your home's value as well as a comparison with similar homes in the area
Home Values in the Area
Average Home Value in this Area
Purchase History
| Date | Buyer | Sale Price | Title Company |
|---|---|---|---|
| Bennett Michael Neil | -- | -- | |
| Michael N Bennett | $110,000 | -- | |
| Johnson Charles C | $90,500 | -- | |
| Joseph Roper | -- | -- | |
| Joseph D Roper Int | $38,500 | -- | |
| Whitaker Charlie R | $3,900 | -- | |
| Copeland Wayne B | $3,300 | -- | |
| Whitaker Charlie R | -- | -- |
Source: Public Records
Tax History Compared to Growth
Tax History
| Year | Tax Paid | Tax Assessment Tax Assessment Total Assessment is a certain percentage of the fair market value that is determined by local assessors to be the total taxable value of land and additions on the property. | Land | Improvement |
|---|---|---|---|---|
| 2024 | $1,934 | $70,924 | $10,000 | $60,924 |
| 2023 | $1,914 | $70,168 | $10,000 | $60,168 |
| 2022 | $1,874 | $67,128 | $10,000 | $57,128 |
| 2021 | $1,769 | $58,656 | $8,000 | $50,656 |
| 2020 | $1,769 | $58,656 | $8,000 | $50,656 |
| 2019 | $1,678 | $55,628 | $8,000 | $47,628 |
| 2018 | $1,678 | $55,628 | $8,000 | $47,628 |
| 2017 | $1,678 | $55,628 | $8,000 | $47,628 |
| 2016 | $1,427 | $47,308 | $6,000 | $41,308 |
| 2015 | $1,429 | $47,308 | $6,000 | $41,308 |
| 2014 | $1,500 | $49,584 | $6,000 | $43,584 |
| 2013 | -- | $49,584 | $6,000 | $43,584 |
Source: Public Records
Map
Nearby Homes
- 641 Whitaker Rd
- 108 Spring Valley Dr
- 104 Spring Valley Dr
- 208 Highland Trail
- 200 Cheyenne Dr
- 117 Brookwood Dr
- 223 Pinehaven Dr
- 102 Willowcrest Way
- 146 Whitaker Rd
- 0 Cameron Mill Rd Unit 10640133
- E Angela Dr
- 654 Cameron Mill Rd
- LOT 4 Angela Dr
- 114 Morgan Dr
- 116 Morgan Dr
- 114-116 Morgan Dr
- 101 Deal Dr
- 114 Millridge Dr
- 116 Deal Dr
- 3 Reed Dr
- 701 Whitaker Rd
- 675 Whitaker Rd Unit Lot 12
- 675 Whitaker Rd
- 690 Whitaker Rd
- 721 Whitaker Rd
- 701 Underwood Dr
- 714 Whitaker Rd
- 703 Underwood Dr
- 741 Whitaker Rd
- 705 Underwood Dr
- 728 Whitaker Rd
- 700 Underwood Dr
- 1589 New Franklin Rd
- 701 Milliken Terrace
- 740 Whitaker Rd
- 757 Whitaker Rd
- 702 Underwood Dr
- 752 Whitaker Rd
- 615 Whitaker Rd
- 771 Whitaker Rd