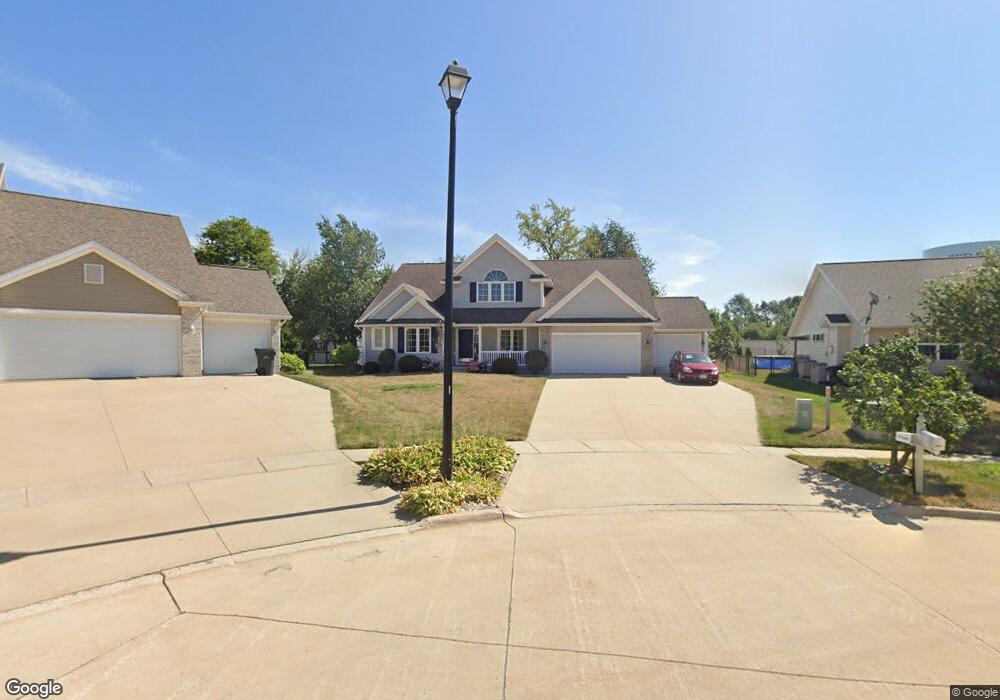
6911 Rolling Ridge Ct SW Cedar Rapids, IA 52404
Lincolnway Village NeighborhoodEstimated Value: $406,000 - $427,000
4
Beds
3
Baths
2,741
Sq Ft
$151/Sq Ft
Est. Value
About This Home
This home is located at 6911 Rolling Ridge Ct SW, Cedar Rapids, IA 52404 and is currently estimated at $415,199, approximately $151 per square foot. 6911 Rolling Ridge Ct SW is a home located in Linn County with nearby schools including Prairie Heights Elementary School, Prairie Crest Elementary School, and Prairie View Elementary School.
Ownership History
Date
Name
Owned For
Owner Type
Purchase Details
Closed on
Nov 8, 2021
Sold by
Kossayian Stephen E and Kossayian Audrey M
Bought by
Kossayian Stephen Edward and Kossayian Audrey M
Current Estimated Value
Purchase Details
Closed on
Nov 5, 2010
Sold by
Myers Thomas M and Myers Glenda J
Bought by
Kossayian Stephen E and Kossayian Audrey M
Home Financials for this Owner
Home Financials are based on the most recent Mortgage that was taken out on this home.
Original Mortgage
$167,500
Outstanding Balance
$2,497
Interest Rate
4.19%
Mortgage Type
New Conventional
Estimated Equity
$412,702
Purchase Details
Closed on
Jul 18, 2005
Sold by
Jerrys Homes Inc
Bought by
Myers Thomas M and Myers Glenda J
Home Financials for this Owner
Home Financials are based on the most recent Mortgage that was taken out on this home.
Original Mortgage
$229,931
Interest Rate
5.66%
Mortgage Type
Fannie Mae Freddie Mac
Create a Home Valuation Report for This Property
The Home Valuation Report is an in-depth analysis detailing your home's value as well as a comparison with similar homes in the area
Home Values in the Area
Average Home Value in this Area
Purchase History
| Date | Buyer | Sale Price | Title Company |
|---|---|---|---|
| Kossayian Stephen Edward | -- | None Available | |
| Kossayian Stephen E | $259,500 | None Available | |
| Myers Thomas M | $287,000 | -- |
Source: Public Records
Mortgage History
| Date | Status | Borrower | Loan Amount |
|---|---|---|---|
| Open | Kossayian Stephen E | $167,500 | |
| Previous Owner | Myers Thomas M | $229,931 |
Source: Public Records
Tax History Compared to Growth
Tax History
| Year | Tax Paid | Tax Assessment Tax Assessment Total Assessment is a certain percentage of the fair market value that is determined by local assessors to be the total taxable value of land and additions on the property. | Land | Improvement |
|---|---|---|---|---|
| 2025 | $7,218 | $403,600 | $72,000 | $331,600 |
| 2024 | $7,342 | $391,400 | $68,100 | $323,300 |
| 2023 | $7,342 | $391,400 | $68,100 | $323,300 |
| 2022 | $6,484 | $340,300 | $58,400 | $281,900 |
| 2021 | $6,762 | $307,300 | $54,500 | $252,800 |
| 2020 | $6,762 | $305,600 | $54,500 | $251,100 |
| 2019 | $6,104 | $280,700 | $42,800 | $237,900 |
| 2018 | $5,934 | $280,700 | $42,800 | $237,900 |
| 2017 | $5,519 | $277,600 | $42,800 | $234,800 |
| 2016 | $5,519 | $255,000 | $42,800 | $212,200 |
| 2015 | $5,543 | $257,570 | $42,827 | $214,743 |
| 2014 | $5,356 | $257,570 | $42,827 | $214,743 |
| 2013 | $5,086 | $257,570 | $42,827 | $214,743 |
Source: Public Records
Map
Nearby Homes
- 6620 Preston Terrace Ct SW
- 51 Oklahoma Ave SW
- 62 Oklahoma Ave SW
- 5655 Deerwood St SW
- 5750 J St SW
- 49 Devonwood Ave SW
- 5600 Klinger St SW
- 0 6th St & 76th Ave SW Unit 202505956
- 7006 Colpepper Dr SW
- 6812 Artesa Bell Dr SW
- 142 Brighton Cir SW
- 6612 Artesa Bell Dr SW
- 7113 Chenango Ln SW
- 8515 Aldridge Dr SW
- 137 Woodstone Ln SW
- 107 Woodstone Ln SW
- 121 Woodstone Ln SW
- 160 Bethany Loop SW Unit A
- 160 Bethany Loop SW Unit C
- 160 Bethany Loop SW Unit B
- 6905 Rolling Ridge Ct SW
- 6917 Rolling Ridge Ct SW
- 114 Gas Light Ct SW
- 6923 Rolling Ridge Ct SW
- 120 Gas Light Ct SW
- 6902 Rolling Ridge Ct SW
- 108 Gas Light Ct SW
- 6827 College Park Ct SW Unit 11
- 6827 College Park Ct SW Unit 10
- 6827 College Park Ct SW Unit 9
- 6827 College Park Ct SW Unit 8
- 6827 College Park Ct SW Unit 7
- 6827 College Park Ct SW Unit 6
- 6827 College Park Ct SW Unit 5
- 6827 College Park Ct SW Unit 4
- 6827 College Park Ct SW Unit 3
- 6827 College Park Ct SW Unit 2
- 6827 College Park Ct SW Unit 1
- 6827 College Park Ct SW Unit 12
- 202 Gas Light Ct SW