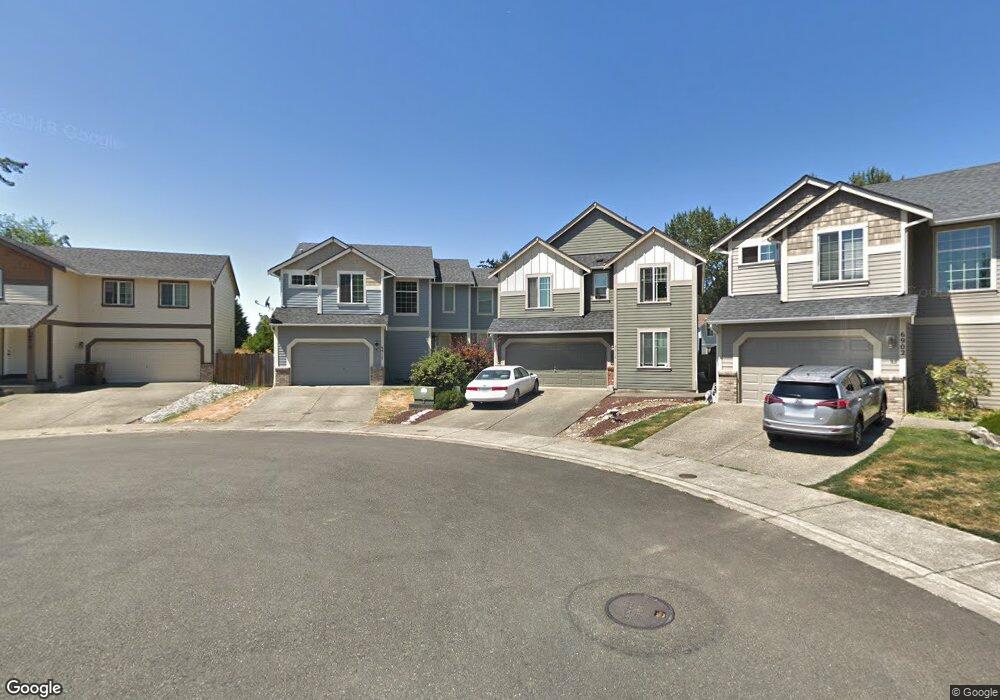
6912 E J St Unit 23 Tacoma, WA 98404
Eastside NeighborhoodEstimated Value: $464,000 - $544,000
3
Beds
3
Baths
1,735
Sq Ft
$285/Sq Ft
Est. Value
About This Home
This home is located at 6912 E J St Unit 23, Tacoma, WA 98404 and is currently estimated at $495,188, approximately $285 per square foot. 6912 E J St Unit 23 is a home located in Pierce County with nearby schools including Boze, First Creek Middle School, and Lincoln High School.
Ownership History
Date
Name
Owned For
Owner Type
Purchase Details
Closed on
Jun 7, 2017
Sold by
Robinson Sandy Lynn and Baker Sandy
Bought by
Wakefield Matthew James and Jia Cuilian
Current Estimated Value
Home Financials for this Owner
Home Financials are based on the most recent Mortgage that was taken out on this home.
Original Mortgage
$217,600
Outstanding Balance
$180,998
Interest Rate
4.02%
Mortgage Type
New Conventional
Estimated Equity
$314,190
Purchase Details
Closed on
Nov 19, 2014
Sold by
Beach Laura S
Bought by
Baker Sandy
Purchase Details
Closed on
Sep 18, 2008
Sold by
Sound Built Homes Inc
Bought by
Beach Laura S
Home Financials for this Owner
Home Financials are based on the most recent Mortgage that was taken out on this home.
Original Mortgage
$224,955
Interest Rate
6.51%
Mortgage Type
Purchase Money Mortgage
Create a Home Valuation Report for This Property
The Home Valuation Report is an in-depth analysis detailing your home's value as well as a comparison with similar homes in the area
Home Values in the Area
Average Home Value in this Area
Purchase History
| Date | Buyer | Sale Price | Title Company |
|---|---|---|---|
| Wakefield Matthew James | $277,337 | F A T C O | |
| Baker Sandy | $177,719 | Ticor | |
| Beach Laura S | $249,950 | Fatco |
Source: Public Records
Mortgage History
| Date | Status | Borrower | Loan Amount |
|---|---|---|---|
| Open | Wakefield Matthew James | $217,600 | |
| Previous Owner | Beach Laura S | $224,955 |
Source: Public Records
Tax History
| Year | Tax Paid | Tax Assessment Tax Assessment Total Assessment is a certain percentage of the fair market value that is determined by local assessors to be the total taxable value of land and additions on the property. | Land | Improvement |
|---|---|---|---|---|
| 2025 | $4,556 | $464,900 | $169,200 | $295,700 |
| 2024 | $4,556 | $441,200 | $162,800 | $278,400 |
| 2023 | $4,556 | $409,100 | $156,400 | $252,700 |
| 2022 | $4,134 | $419,400 | $165,700 | $253,700 |
| 2021 | $3,855 | $306,600 | $102,800 | $203,800 |
| 2019 | $3,397 | $280,000 | $85,800 | $194,200 |
| 2018 | $3,691 | $261,300 | $69,700 | $191,600 |
| 2017 | $3,263 | $233,600 | $51,900 | $181,700 |
| 2016 | $2,831 | $178,800 | $39,300 | $139,500 |
| 2014 | $2,423 | $162,800 | $35,900 | $126,900 |
| 2013 | $2,423 | $145,100 | $31,900 | $113,200 |
Source: Public Records
Map
Nearby Homes
- 1109 E 70th St
- 830 E 66th St
- 609 E 69th St
- 602 E 68th St
- 7225 E G St
- 6965 E E St
- 1319 E 66th St
- 1013 1015 76th Street Ct E Unit 1-8
- 509 E 65th St
- 610 E 75th St
- 7426 Portland Ave E
- 7802 Golden Given Rd E
- 7552 E F St
- 6601 -6605 E B St
- 1113 E 61st St
- 6501 E B St
- 521 E 78th St
- 220 E 63rd St
- 1310 E 60th St
- 7918 Mckinley Ave
Your Personal Tour Guide
Ask me questions while you tour the home.