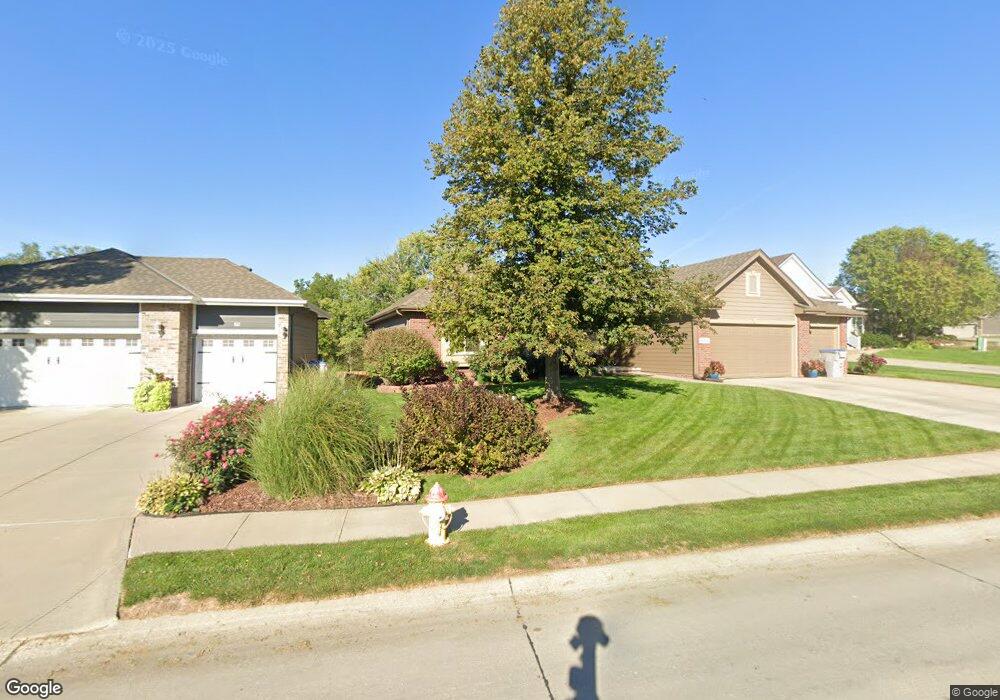
6914 S 164th Ave Omaha, NE 68136
Millard Park NeighborhoodEstimated Value: $430,000 - $442,776
4
Beds
3
Baths
3,269
Sq Ft
$133/Sq Ft
Est. Value
About This Home
This home is located at 6914 S 164th Ave, Omaha, NE 68136 and is currently estimated at $434,944, approximately $133 per square foot. 6914 S 164th Ave is a home located in Sarpy County with nearby schools including Black Elk Elementary School, Beadle Middle School, and Millard West High School.
Ownership History
Date
Name
Owned For
Owner Type
Purchase Details
Closed on
Nov 14, 2018
Sold by
De Maria Salvatore De and De Maria Carolyn
Bought by
Demaria Salvatore and Demaria Carolyn
Current Estimated Value
Purchase Details
Closed on
Apr 19, 2010
Sold by
Federal National Mortgage Association
Bought by
Demaria Salvatore A and Demaria Carolyn E
Home Financials for this Owner
Home Financials are based on the most recent Mortgage that was taken out on this home.
Original Mortgage
$135,000
Outstanding Balance
$89,378
Interest Rate
4.88%
Mortgage Type
New Conventional
Estimated Equity
$345,566
Purchase Details
Closed on
Sep 24, 2009
Sold by
Charlson Robert P and Charlson Debroah K
Bought by
First National Bank Of Omaha
Purchase Details
Closed on
Aug 7, 2000
Sold by
Belt Construction Co Inc
Bought by
Charlson Robert P and Charlson Deborah K
Home Financials for this Owner
Home Financials are based on the most recent Mortgage that was taken out on this home.
Original Mortgage
$202,428
Interest Rate
8.22%
Create a Home Valuation Report for This Property
The Home Valuation Report is an in-depth analysis detailing your home's value as well as a comparison with similar homes in the area
Home Values in the Area
Average Home Value in this Area
Purchase History
| Date | Buyer | Sale Price | Title Company |
|---|---|---|---|
| Demaria Salvatore | -- | None Available | |
| Demaria Salvatore A | -- | Nlta | |
| First National Bank Of Omaha | $188,492 | None Available | |
| Charlson Robert P | $225,000 | -- |
Source: Public Records
Mortgage History
| Date | Status | Borrower | Loan Amount |
|---|---|---|---|
| Open | Demaria Salvatore A | $135,000 | |
| Previous Owner | Charlson Robert P | $202,428 |
Source: Public Records
Tax History Compared to Growth
Tax History
| Year | Tax Paid | Tax Assessment Tax Assessment Total Assessment is a certain percentage of the fair market value that is determined by local assessors to be the total taxable value of land and additions on the property. | Land | Improvement |
|---|---|---|---|---|
| 2025 | $7,307 | $439,731 | $69,000 | $370,731 |
| 2024 | $7,859 | $425,819 | $69,000 | $356,819 |
| 2023 | $7,859 | $386,512 | $57,000 | $329,512 |
| 2022 | $7,374 | $340,235 | $55,000 | $285,235 |
| 2021 | $7,132 | $325,491 | $52,000 | $273,491 |
| 2020 | $6,989 | $315,342 | $52,000 | $263,342 |
| 2019 | $7,492 | $305,692 | $52,000 | $253,692 |
| 2018 | $7,188 | $291,718 | $45,000 | $246,718 |
| 2017 | $6,992 | $276,284 | $41,000 | $235,284 |
| 2016 | $6,671 | $262,178 | $41,000 | $221,178 |
| 2015 | $6,361 | $248,758 | $41,000 | $207,758 |
| 2014 | $5,549 | $216,471 | $41,000 | $175,471 |
| 2012 | -- | $216,828 | $41,000 | $175,828 |
Source: Public Records
Map
Nearby Homes
- 7011 S 167th Ave
- 7501 S 166th St
- 16641 Olive St
- 16113 Josephine St
- 16130 Timberlane Dr
- 7216 S 170th St
- 16108 Adams St
- 16125 Timberlane Dr
- 7714 S 167th St
- 6441 S 159th Ave
- 16367 Y St
- 7734 S 162nd St
- 6328 S 172nd St
- 7810 S 166th St
- 7730 S 161st Terrace
- 7705 S 169th St
- 7501 S 170th St
- 16112 Cottonwood Ave
- 16528 Briar St
- 15818 Timberlane Dr
- 6914 164
- 7010 S 164th Ave
- 6912 S 164th Ave
- 6908 S 164th Ave
- 7014 S 164th Ave
- 6908 S 164th Ave
- 16421 Audrey St
- 6911 S 164th Ave
- 7013 S 164th Ave
- 16414 Josephine St
- 16417 Audrey St
- 16427 Josephine St
- 16413 Audrey St
- 16436 Audrey Cir
- 16410 Josephine St
- 16432 Audrey St
- 6910 S 164th St
- 16423 Josephine St
- 16428 Audrey St
- 16440 Audrey Cir