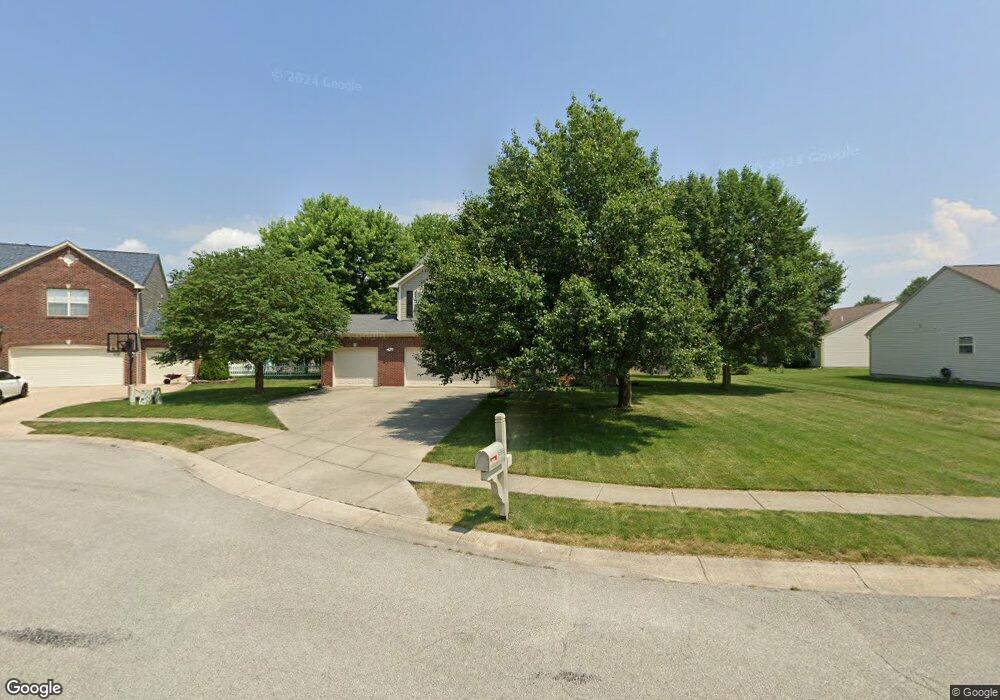
6918 Mahogany Ct Plainfield, IN 46168
Estimated Value: $379,000 - $424,000
5
Beds
3
Baths
3,190
Sq Ft
$126/Sq Ft
Est. Value
About This Home
This home is located at 6918 Mahogany Ct, Plainfield, IN 46168 and is currently estimated at $401,426, approximately $125 per square foot. 6918 Mahogany Ct is a home located in Hendricks County with nearby schools including White Oak Elementary School, Cedar Elementary School, and Avon Intermediate School West.
Ownership History
Date
Name
Owned For
Owner Type
Purchase Details
Closed on
Dec 28, 2015
Sold by
Doyle Kevin
Bought by
Doyle Amy N
Current Estimated Value
Purchase Details
Closed on
Oct 18, 2005
Sold by
Karsten Adam R and Karsten Angela D
Bought by
Doyle Kevin and Doyle Amy
Home Financials for this Owner
Home Financials are based on the most recent Mortgage that was taken out on this home.
Original Mortgage
$40,980
Outstanding Balance
$22,380
Interest Rate
5.89%
Mortgage Type
Stand Alone Second
Estimated Equity
$379,046
Purchase Details
Closed on
Mar 9, 2005
Sold by
Westport Homes Inc
Bought by
Karsten Adam R and Karsten Angela D
Home Financials for this Owner
Home Financials are based on the most recent Mortgage that was taken out on this home.
Original Mortgage
$29,934
Interest Rate
5.61%
Mortgage Type
Credit Line Revolving
Create a Home Valuation Report for This Property
The Home Valuation Report is an in-depth analysis detailing your home's value as well as a comparison with similar homes in the area
Home Values in the Area
Average Home Value in this Area
Purchase History
| Date | Buyer | Sale Price | Title Company |
|---|---|---|---|
| Doyle Amy N | -- | -- | |
| Doyle Kevin | -- | Midwest Title Corporation | |
| Karsten Adam R | -- | None Available |
Source: Public Records
Mortgage History
| Date | Status | Borrower | Loan Amount |
|---|---|---|---|
| Open | Doyle Kevin | $40,980 | |
| Previous Owner | Doyle Kevin | $163,920 | |
| Previous Owner | Karsten Adam R | $29,934 | |
| Previous Owner | Karsten Adam R | $159,648 |
Source: Public Records
Tax History Compared to Growth
Tax History
| Year | Tax Paid | Tax Assessment Tax Assessment Total Assessment is a certain percentage of the fair market value that is determined by local assessors to be the total taxable value of land and additions on the property. | Land | Improvement |
|---|---|---|---|---|
| 2024 | $3,850 | $341,000 | $50,200 | $290,800 |
| 2023 | $3,553 | $316,600 | $45,600 | $271,000 |
| 2022 | $3,544 | $313,300 | $44,700 | $268,600 |
| 2021 | $3,213 | $274,700 | $41,900 | $232,800 |
| 2020 | $3,068 | $259,900 | $41,900 | $218,000 |
| 2019 | $2,882 | $240,900 | $39,900 | $201,000 |
| 2018 | $2,852 | $234,200 | $39,900 | $194,300 |
| 2017 | $2,350 | $225,000 | $38,400 | $186,600 |
| 2016 | $2,289 | $218,900 | $38,400 | $180,500 |
| 2014 | $2,164 | $216,400 | $37,600 | $178,800 |
Source: Public Records
Map
Nearby Homes
- 6900 Barberry Ct
- 2434 Burgundy Way
- 0 S Avon Ave Unit MBR22032323
- 6589 Avalon Blvd
- 6862 Trailside Dr
- 7128 Verwood Ct
- 7315 Hidden Valley Dr
- 1914 S State Rd
- 1914 Delp Ct
- 7370 Hidden Valley Dr
- 7356 Oakview Dr
- 1810 Salina Dr
- 7440 Oakview Dr
- 7686 Rolling Green Dr
- 6374 Timberbluff Cir
- 7047 Lancaster Ln
- 6229 Catalpa Dr
- 1829 Bentbrook Dr
- 2336 Oakmont Dr
- 7574 Williamsburg Dr
- 6938 Mahogany Ct
- 2304 Burgundy Way
- 6908 Mahogany Ct
- 6917 Barberry Ct
- 6907 Barberry Ct
- 2284 Burgundy Way
- 6902 Mahogany Ct
- 2354 Burgundy Way
- 6919 Mahogany Ct
- 6460 Barberry Ct
- 6901 Barberry Ct
- 6909 Mahogany Ct
- 2323 Burgundy Way
- 2303 Burgundy Way
- 2333 Burgundy Way
- 2374 Burgundy Way
- 2283 Burgundy Way
- 6936 Barberry Ct
- 2353 Burgundy Way
- 6916 Barberry Ct