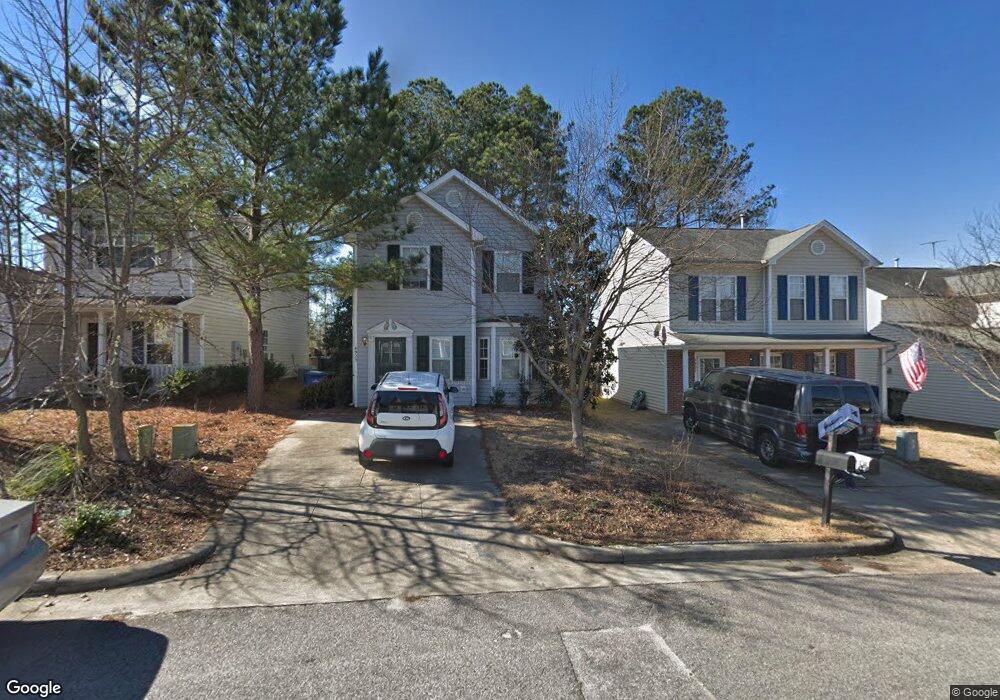
6923 Jeffreys Creek Ln Raleigh, NC 27616
Forestville NeighborhoodEstimated Value: $226,000 - $276,000
2
Beds
2
Baths
1,109
Sq Ft
$222/Sq Ft
Est. Value
About This Home
This home is located at 6923 Jeffreys Creek Ln, Raleigh, NC 27616 and is currently estimated at $246,600, approximately $222 per square foot. 6923 Jeffreys Creek Ln is a home located in Wake County with nearby schools including Fox Road Elementary School, Wake Forest-Rolesville Middle School, and Wakefield High School.
Ownership History
Date
Name
Owned For
Owner Type
Purchase Details
Closed on
Jan 7, 2013
Sold by
Swanson Meagan W
Bought by
Zhang Yuying
Current Estimated Value
Purchase Details
Closed on
Jul 16, 2008
Sold by
Rickard Antha E
Bought by
Swanson Meagan W
Home Financials for this Owner
Home Financials are based on the most recent Mortgage that was taken out on this home.
Original Mortgage
$122,713
Interest Rate
6.03%
Mortgage Type
FHA
Purchase Details
Closed on
May 4, 2001
Sold by
Anderson Homes Inc
Bought by
Rickard Antha E
Home Financials for this Owner
Home Financials are based on the most recent Mortgage that was taken out on this home.
Original Mortgage
$116,900
Interest Rate
7.02%
Mortgage Type
FHA
Create a Home Valuation Report for This Property
The Home Valuation Report is an in-depth analysis detailing your home's value as well as a comparison with similar homes in the area
Home Values in the Area
Average Home Value in this Area
Purchase History
| Date | Buyer | Sale Price | Title Company |
|---|---|---|---|
| Zhang Yuying | $65,000 | None Available | |
| Swanson Meagan W | $128,000 | None Available | |
| Rickard Antha E | $118,000 | -- |
Source: Public Records
Mortgage History
| Date | Status | Borrower | Loan Amount |
|---|---|---|---|
| Previous Owner | Swanson Meagan W | $122,713 | |
| Previous Owner | Rickard Antha E | $116,900 |
Source: Public Records
Tax History Compared to Growth
Tax History
| Year | Tax Paid | Tax Assessment Tax Assessment Total Assessment is a certain percentage of the fair market value that is determined by local assessors to be the total taxable value of land and additions on the property. | Land | Improvement |
|---|---|---|---|---|
| 2025 | $2,245 | $255,121 | $65,000 | $190,121 |
| 2024 | $2,236 | $255,121 | $65,000 | $190,121 |
| 2023 | $1,834 | $166,462 | $48,000 | $118,462 |
| 2022 | $1,705 | $166,462 | $48,000 | $118,462 |
| 2021 | $1,640 | $166,462 | $48,000 | $118,462 |
| 2020 | $1,610 | $166,462 | $48,000 | $118,462 |
| 2019 | $1,516 | $129,122 | $42,000 | $87,122 |
| 2018 | $1,431 | $129,122 | $42,000 | $87,122 |
| 2017 | $1,363 | $129,122 | $42,000 | $87,122 |
| 2016 | $1,336 | $129,122 | $42,000 | $87,122 |
| 2015 | $1,324 | $125,885 | $38,000 | $87,885 |
| 2014 | $1,256 | $125,885 | $38,000 | $87,885 |
Source: Public Records
Map
Nearby Homes
- 7026 Jeffreys Creek Ln
- 6923 Fox Haven Place
- 7205 Beaverwood Dr
- 5208 Botany Bay Dr
- 7317 Fox Rd
- 5223 Botany Bay Dr
- 4804 Red Coat Ct
- 2873 Springtooth Dr
- 7313 Jacqueline Ln
- 6305 Musket Ball Ct
- 4804 Sinclair Dr
- 4420 Archibald Way
- 4809 Hallam Way
- 6205 Remington Lake Dr
- 4833 Draper Rd
- 4905 Will-O-dean Rd
- 4610 Jacqueline Ln
- 4604 Jacqueline Ln
- 6016 Four Townes Ln
- 4616 Draper Rd
- 6925 Jeffreys Creek Ln
- 6919 Jeffreys Creek Ln
- 6917 Jeffreys Creek Ln
- 6929 Jeffreys Creek Ln
- 6915 Jeffreys Creek Ln
- Lot 2 Jeffreys Creek Ln
- 6920 Jeffreys Creek Ln
- 6918 Jeffreys Creek Ln
- 6924 Jeffreys Creek Ln
- 6913 Jeffreys Creek Ln
- 6914 Jeffreys Creek Ln
- 6926 Jeffreys Creek Ln
- 7001 Jeffreys Creek Ln
- 6930 Jeffreys Creek Ln
- 6912 Jeffreys Creek Ln
- 6909 Jeffreys Creek Ln
- 6932 Jeffreys Creek Ln
- 7000 Jeffreys Creek Ln
- 7005 Jeffreys Creek Ln
- 6907 Jeffreys Creek Ln