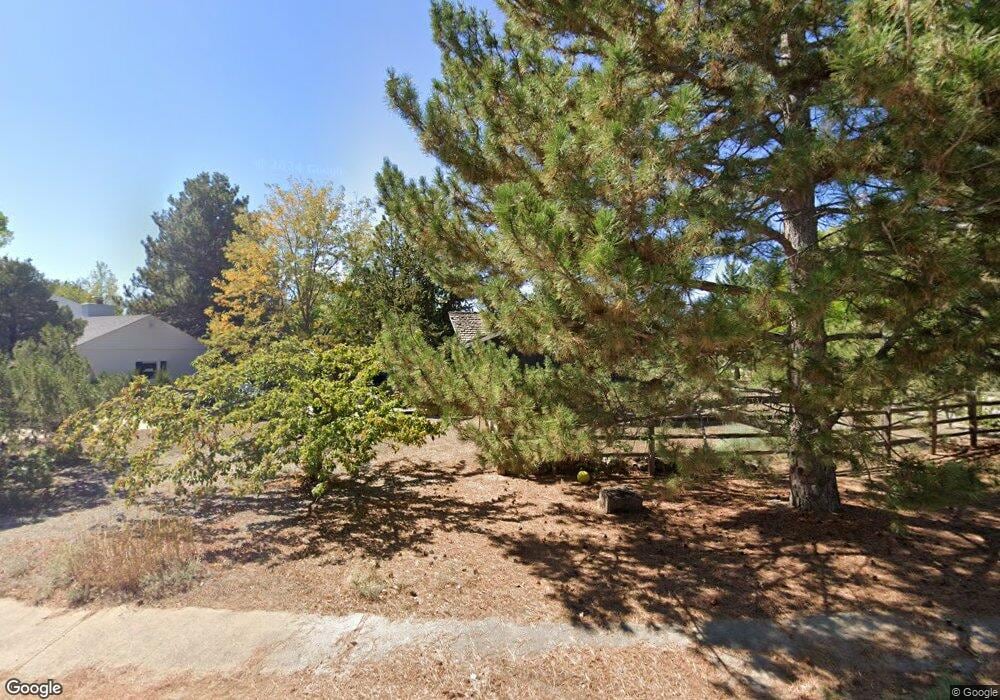
6925 Frying Pan Rd Boulder, CO 80301
Gunbarrel NeighborhoodEstimated Value: $1,024,319 - $1,116,000
5
Beds
3
Baths
3,009
Sq Ft
$351/Sq Ft
Est. Value
About This Home
This home is located at 6925 Frying Pan Rd, Boulder, CO 80301 and is currently estimated at $1,057,080, approximately $351 per square foot. 6925 Frying Pan Rd is a home located in Boulder County with nearby schools including Heatherwood Elementary School, Nevin Platt Middle School, and Boulder High School.
Ownership History
Date
Name
Owned For
Owner Type
Purchase Details
Closed on
Mar 30, 2015
Sold by
Weinstein Jonathan
Bought by
Weinstein Jonathan
Current Estimated Value
Purchase Details
Closed on
Feb 10, 2010
Sold by
Albarian Juliette H
Bought by
Weinstein Jonathan
Home Financials for this Owner
Home Financials are based on the most recent Mortgage that was taken out on this home.
Original Mortgage
$361,212
Outstanding Balance
$231,861
Interest Rate
4.75%
Mortgage Type
FHA
Estimated Equity
$825,219
Purchase Details
Closed on
May 17, 2002
Sold by
Lees John W and Lees Barbara L
Bought by
Albarian Samuel G and Albarian Juliette H
Home Financials for this Owner
Home Financials are based on the most recent Mortgage that was taken out on this home.
Original Mortgage
$268,200
Interest Rate
7.1%
Mortgage Type
Purchase Money Mortgage
Purchase Details
Closed on
Dec 31, 1980
Bought by
Weinstein Jonathan
Purchase Details
Closed on
Mar 12, 1979
Bought by
Weinstein Jonathan
Create a Home Valuation Report for This Property
The Home Valuation Report is an in-depth analysis detailing your home's value as well as a comparison with similar homes in the area
Home Values in the Area
Average Home Value in this Area
Purchase History
| Date | Buyer | Sale Price | Title Company |
|---|---|---|---|
| Weinstein Jonathan | -- | None Available | |
| Weinstein Jonathan | $376,000 | Utc | |
| Albarian Samuel G | $387,900 | Guardian Title Agency Llc | |
| Weinstein Jonathan | $127,000 | -- | |
| Weinstein Jonathan | $96,000 | -- |
Source: Public Records
Mortgage History
| Date | Status | Borrower | Loan Amount |
|---|---|---|---|
| Open | Weinstein Jonathan | $361,212 | |
| Previous Owner | Albarian Samuel G | $268,200 |
Source: Public Records
Tax History
| Year | Tax Paid | Tax Assessment Tax Assessment Total Assessment is a certain percentage of the fair market value that is determined by local assessors to be the total taxable value of land and additions on the property. | Land | Improvement |
|---|---|---|---|---|
| 2025 | $5,763 | $61,232 | $33,988 | $27,244 |
| 2024 | $5,763 | $61,232 | $33,988 | $27,244 |
| 2023 | $5,668 | $62,290 | $36,830 | $29,145 |
| 2022 | $4,802 | $49,185 | $27,418 | $21,767 |
| 2021 | $4,579 | $50,601 | $28,207 | $22,394 |
| 2020 | $4,165 | $45,496 | $24,668 | $20,828 |
| 2019 | $4,101 | $45,496 | $24,668 | $20,828 |
| 2018 | $3,881 | $42,566 | $20,592 | $21,974 |
| 2017 | $3,765 | $47,060 | $22,766 | $24,294 |
| 2016 | $3,394 | $37,229 | $18,945 | $18,284 |
| 2015 | $3,223 | $33,369 | $17,353 | $16,016 |
| 2014 | $3,146 | $33,369 | $17,353 | $16,016 |
Source: Public Records
Map
Nearby Homes
- 6844 Roaring Fork Trail
- 6972 Roaring Fork Trail
- 6923 Hunter Place
- 5273 Idylwild Trail
- 0 Cottonwood Dr
- 6838 Harvest Rd
- 5292 Sun Dial Place
- 5302 Pinehurst Dr
- 5012 Carter Ct
- 5237 Deer Creek Ct
- 7134 Cedarwood Cir
- 5531 High Country Ct
- 4945 Twin Lakes Rd Unit 39
- 7088 Indian Peaks Trail
- 4872 Country Club Way
- 5646 Rim Rock Ct
- 4862 Silver Sage Ct
- 5120 Williams Fork Trail Unit 210
- 5120 Williams Fork Trail Unit 5120-213
- 5120 Williams Fork Trail Unit 206
- 6919 Frying Pan Rd
- 0 Roaring Fork Trail Unit 931577
- 6888 Roaring Fork Trail
- 6889 Roaring Fork Trail
- 6930 Roaring Fork Trail
- 6907 Roaring Fork Trail
- 6903 Frying Pan Rd
- 6922 Frying Pan Rd
- 5220 Spotted Horse Trail
- 6878 Roaring Fork Trail
- 6919 Roaring Fork Trail
- 6918 Frying Pan Rd
- 6942 Roaring Fork Trail
- 5242 Spotted Horse Trail
- 0 Frying Pan Rd
- 5262 Spotted Horse Trail
- 6910 Frying Pan Rd
- 6931 Roaring Fork Trail
- 5270 Spotted Horse Trail
- 6862 Roaring Fork Trail
Your Personal Tour Guide
Ask me questions while you tour the home.