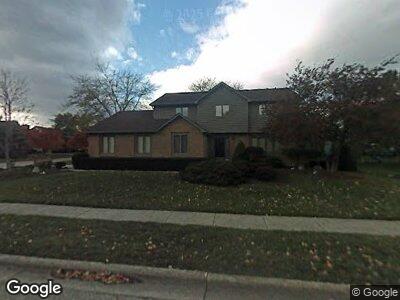
6929 Bonnie Brae Ln Columbus, OH 43235
Stilson NeighborhoodEstimated Value: $579,000 - $707,000
4
Beds
3
Baths
3,387
Sq Ft
$189/Sq Ft
Est. Value
About This Home
This home is located at 6929 Bonnie Brae Ln, Columbus, OH 43235 and is currently estimated at $641,298, approximately $189 per square foot. 6929 Bonnie Brae Ln is a home located in Franklin County with nearby schools including Bluffsview Elementary School, McCord Middle School, and Worthington Kilbourne High School.
Ownership History
Date
Name
Owned For
Owner Type
Purchase Details
Closed on
Dec 27, 2013
Sold by
Williams Douglas L
Bought by
Chilcoat Shaw Nathan and Chilcoat Shaw Jennifer
Current Estimated Value
Home Financials for this Owner
Home Financials are based on the most recent Mortgage that was taken out on this home.
Original Mortgage
$160,000
Interest Rate
4.23%
Mortgage Type
Purchase Money Mortgage
Purchase Details
Closed on
May 9, 2002
Sold by
Phillips Steven W and Phillips Debra H
Bought by
Williams Douglas L
Home Financials for this Owner
Home Financials are based on the most recent Mortgage that was taken out on this home.
Original Mortgage
$247,500
Interest Rate
7.07%
Mortgage Type
Balloon
Purchase Details
Closed on
Jan 31, 1986
Bought by
Phillips Steven W
Purchase Details
Closed on
Apr 1, 1985
Purchase Details
Closed on
Dec 1, 1983
Create a Home Valuation Report for This Property
The Home Valuation Report is an in-depth analysis detailing your home's value as well as a comparison with similar homes in the area
Home Values in the Area
Average Home Value in this Area
Purchase History
| Date | Buyer | Sale Price | Title Company |
|---|---|---|---|
| Chilcoat Shaw Nathan | $290,000 | Valmer Land Title Agency Box | |
| Williams Douglas L | $277,500 | -- | |
| Phillips Steven W | $160,000 | -- | |
| -- | $135,000 | -- | |
| -- | $34,000 | -- |
Source: Public Records
Mortgage History
| Date | Status | Borrower | Loan Amount |
|---|---|---|---|
| Open | Shaw Nathan | $89,800 | |
| Open | Shaw Nathan P | $247,000 | |
| Closed | Shaw Nathan P | $117,800 | |
| Closed | Shaw Nathan | $86,500 | |
| Closed | Chilcoat Shaw Nathan | $160,000 | |
| Closed | Williams Douglas L | $80,000 | |
| Closed | Williams Douglas L | $245,000 | |
| Closed | Williams Douglas L | $247,500 |
Source: Public Records
Tax History Compared to Growth
Tax History
| Year | Tax Paid | Tax Assessment Tax Assessment Total Assessment is a certain percentage of the fair market value that is determined by local assessors to be the total taxable value of land and additions on the property. | Land | Improvement |
|---|---|---|---|---|
| 2024 | $12,369 | $201,470 | $45,260 | $156,210 |
| 2023 | $11,828 | $201,470 | $45,260 | $156,210 |
| 2022 | $11,946 | $161,460 | $36,090 | $125,370 |
| 2021 | $11,021 | $161,460 | $36,090 | $125,370 |
| 2020 | $10,616 | $161,460 | $36,090 | $125,370 |
| 2019 | $10,446 | $143,370 | $31,400 | $111,970 |
| 2018 | $5,060 | $143,370 | $31,400 | $111,970 |
| 2017 | $9,057 | $138,710 | $31,400 | $107,310 |
| 2016 | $8,300 | $116,900 | $26,600 | $90,300 |
| 2015 | $3,604 | $101,500 | $26,600 | $74,900 |
| 2014 | $7,205 | $101,500 | $26,600 | $74,900 |
| 2013 | $3,879 | $109,830 | $24,185 | $85,645 |
Source: Public Records
Map
Nearby Homes
- 1200 Drumbarton Ct
- 941 Macgregor Ave
- 6909 Olentangy River Rd
- 1192 Tessier Dr
- 1123 Firth Ave
- 7347 Fall Creek Ln Unit J
- 833 Bluffway Dr
- 6620 Mcvey Blvd
- 825 Bluffview Dr
- 6765 Lakeside Cir E
- 1672 Flat Rock Ct
- 7731 Sefton Park Dr
- 460 Blandings Ct
- 1721 Worthington Run Dr Unit 1721-1731
- 1068 Rutherglen Dr
- 1018 Rutherglen Dr
- 6212 Hutchinson St
- 1813 Worthington Run Dr Unit A
- 6653 Merwin Rd
- 1157 Strathaven Ct W
- 6929 Bonnie Brae Ln
- 1072 Limberlost Ct
- 6937 Bonnie Brae Ln
- 1071 Baumock Burn Dr
- 6936 Bonnie Brae Ln
- 1084 Limberlost Ct
- 6915 Bonnie Brae Ln
- 6928 Bonnie Brae Ln
- 1079 Baumock Burn Dr
- 1073 Limberlost Ct
- 6944 Bonnie Brae Ln
- 6920 Bonnie Brae Ln
- 1085 Limberlost Ct
- 1093 Baumock Burn Dr
- 1096 Limberlost Ct
- 6897 Bonnie Brae Ln
- 6912 Bonnie Brae Ln
- 1052 Baumock Burn Dr
- 6952 Bonnie Brae Ln
- 1097 Limberlost Ct