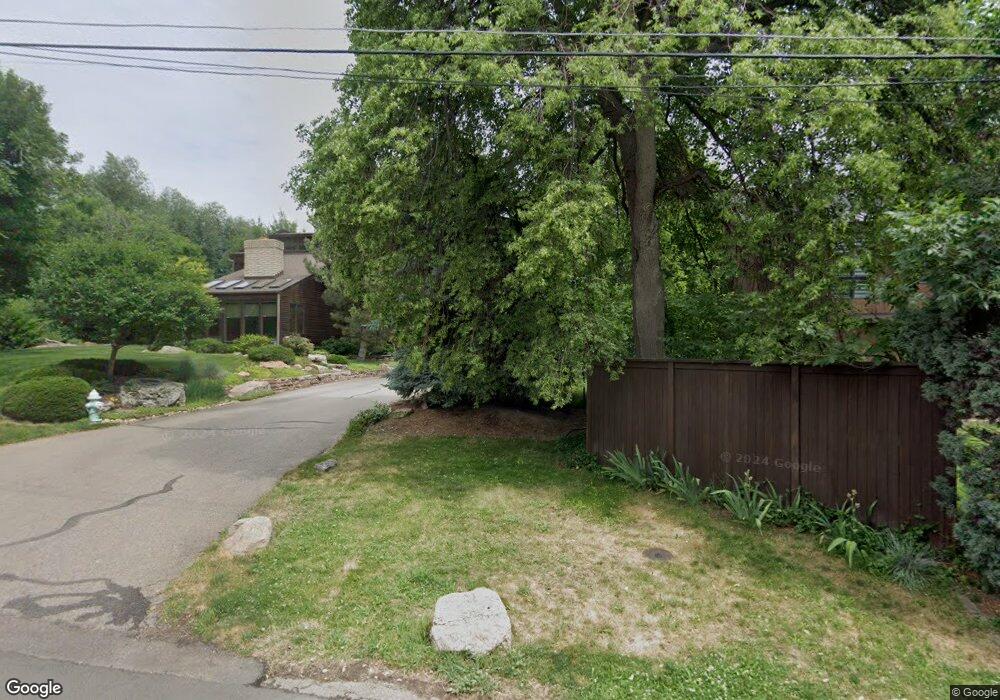
693 Kalmia Ave Boulder, CO 80304
Newlands NeighborhoodEstimated Value: $2,364,006 - $2,820,000
3
Beds
3
Baths
3,214
Sq Ft
$784/Sq Ft
Est. Value
About This Home
This home is located at 693 Kalmia Ave, Boulder, CO 80304 and is currently estimated at $2,519,502, approximately $783 per square foot. 693 Kalmia Ave is a home located in Boulder County with nearby schools including Foothill Elementary School, Centennial Middle School, and Boulder High School.
Ownership History
Date
Name
Owned For
Owner Type
Purchase Details
Closed on
Apr 13, 2007
Sold by
Gurule Barry L and Gurule Connie L
Bought by
Kimberly Oliver A and Kimberly Elizabeth L
Current Estimated Value
Home Financials for this Owner
Home Financials are based on the most recent Mortgage that was taken out on this home.
Original Mortgage
$575,000
Outstanding Balance
$348,424
Interest Rate
6.19%
Mortgage Type
Purchase Money Mortgage
Estimated Equity
$2,171,078
Purchase Details
Closed on
Nov 6, 1992
Bought by
Kimberly Oliver A and Kimberly Elizabeth L
Purchase Details
Closed on
Oct 3, 1988
Bought by
Kimberly Oliver A and Kimberly Elizabeth L
Purchase Details
Closed on
Oct 26, 1979
Bought by
Kimberly Oliver A and Kimberly Elizabeth L
Purchase Details
Closed on
Jun 15, 1979
Bought by
Kimberly Oliver A and Kimberly Elizabeth L
Create a Home Valuation Report for This Property
The Home Valuation Report is an in-depth analysis detailing your home's value as well as a comparison with similar homes in the area
Home Values in the Area
Average Home Value in this Area
Purchase History
| Date | Buyer | Sale Price | Title Company |
|---|---|---|---|
| Kimberly Oliver A | $863,500 | Landamerica | |
| Kimberly Oliver A | -- | -- | |
| Kimberly Oliver A | -- | -- | |
| Kimberly Oliver A | -- | -- | |
| Kimberly Oliver A | $54,700 | -- |
Source: Public Records
Mortgage History
| Date | Status | Borrower | Loan Amount |
|---|---|---|---|
| Open | Kimberly Oliver A | $575,000 |
Source: Public Records
Tax History Compared to Growth
Tax History
| Year | Tax Paid | Tax Assessment Tax Assessment Total Assessment is a certain percentage of the fair market value that is determined by local assessors to be the total taxable value of land and additions on the property. | Land | Improvement |
|---|---|---|---|---|
| 2025 | $13,643 | $139,488 | $125,539 | $13,949 |
| 2024 | $13,643 | $139,488 | $125,539 | $13,949 |
| 2023 | $13,406 | $155,239 | $143,032 | $15,892 |
| 2022 | $10,994 | $118,387 | $106,548 | $11,839 |
| 2021 | $10,483 | $121,793 | $109,614 | $12,179 |
| 2020 | $8,884 | $102,059 | $81,653 | $20,406 |
| 2019 | $8,748 | $102,059 | $81,653 | $20,406 |
| 2018 | $7,990 | $92,160 | $73,728 | $18,432 |
| 2017 | $7,740 | $101,888 | $81,510 | $20,378 |
| 2016 | $6,167 | $71,242 | $56,994 | $14,248 |
| 2015 | $5,840 | $59,605 | $20,139 | $39,466 |
| 2014 | $5,012 | $59,605 | $20,139 | $39,466 |
Source: Public Records
Map
Nearby Homes
- 701 Kalmia Ave
- 503 Kalmia Ave
- 800 Kalmia Ave
- 855 Kalmia Ave
- 910 Kalmia Ave
- 706 Juniper Ave
- 3561 4th St
- 1127 Juniper Ave
- 440 Japonica Way
- 630 Northstar Ct
- 640 Iris Ave
- 560 Northstar Ct
- 3421 4th St
- 1070 Juniper Ave
- 560 Iris Ave
- 550 Iris Ave
- 864 Iris Ave
- 3747 Mountain Laurel Place
- 711 Hawthorn Ave
- 1172 Juniper Ave