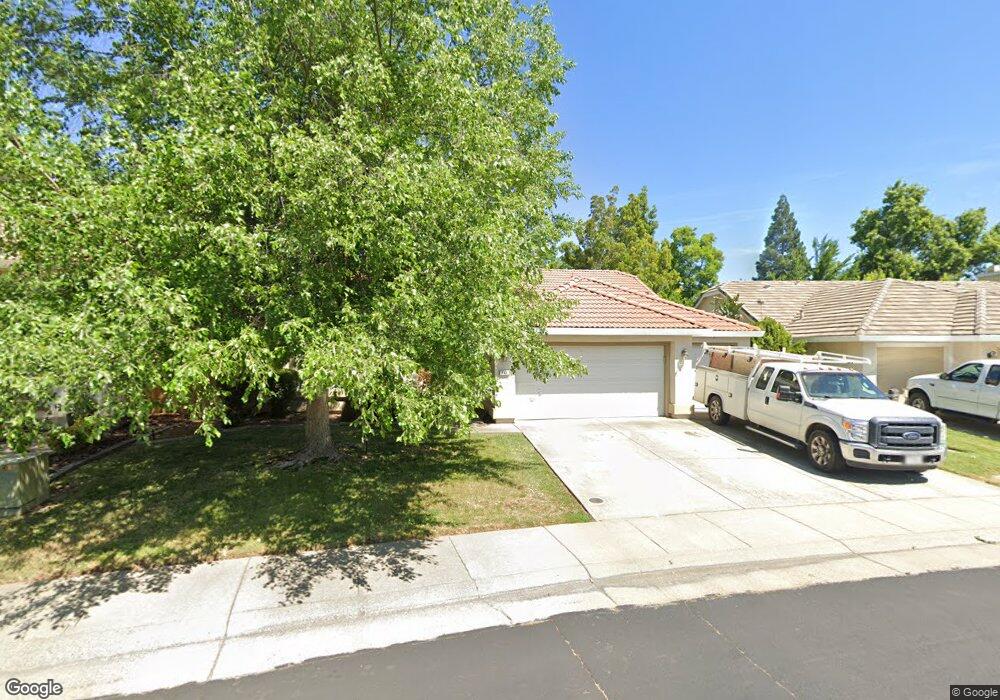
693 Larson Way Folsom, CA 95630
Estimated Value: $682,636 - $765,000
3
Beds
2
Baths
1,800
Sq Ft
$404/Sq Ft
Est. Value
About This Home
This home is located at 693 Larson Way, Folsom, CA 95630 and is currently estimated at $727,879, approximately $404 per square foot. 693 Larson Way is a home located in Sacramento County with nearby schools including Natoma Station Elementary School, Sutter Middle School, and Folsom High School.
Ownership History
Date
Name
Owned For
Owner Type
Purchase Details
Closed on
Jun 12, 2005
Sold by
Lenci Raymond L and Lenci Sharyn L
Bought by
Lenci Raymond L and Lenci Sharyn L
Current Estimated Value
Home Financials for this Owner
Home Financials are based on the most recent Mortgage that was taken out on this home.
Original Mortgage
$327,800
Outstanding Balance
$158,196
Interest Rate
4.6%
Mortgage Type
Negative Amortization
Estimated Equity
$569,683
Purchase Details
Closed on
May 24, 2001
Sold by
Kasaraneni Jagadeesh and Narla Archana
Bought by
Lewis Wesley C and Lewis Louise L
Purchase Details
Closed on
Nov 6, 1998
Sold by
John Mourier Construction Inc
Bought by
Kasaraneni Jagadeesh and Narla Archana
Home Financials for this Owner
Home Financials are based on the most recent Mortgage that was taken out on this home.
Original Mortgage
$157,900
Interest Rate
6.61%
Create a Home Valuation Report for This Property
The Home Valuation Report is an in-depth analysis detailing your home's value as well as a comparison with similar homes in the area
Purchase History
| Date | Buyer | Sale Price | Title Company |
|---|---|---|---|
| Lenci Raymond L | -- | Alliance Title Company | |
| Lenci Raymond L | $513,500 | Alliance Title Company | |
| Lewis Wesley C | $282,000 | Financial Title Company | |
| Kasaraneni Jagadeesh | $197,500 | Old Republic Title Company |
Source: Public Records
Mortgage History
| Date | Status | Borrower | Loan Amount |
|---|---|---|---|
| Open | Lenci Raymond L | $327,800 | |
| Previous Owner | Kasaraneni Jagadeesh | $157,900 | |
| Closed | Kasaraneni Jagadeesh | $19,700 |
Source: Public Records
Tax History
| Year | Tax Paid | Tax Assessment Tax Assessment Total Assessment is a certain percentage of the fair market value that is determined by local assessors to be the total taxable value of land and additions on the property. | Land | Improvement |
|---|---|---|---|---|
| 2025 | $7,646 | $715,758 | $195,139 | $520,619 |
| 2024 | $7,646 | $701,724 | $191,313 | $510,411 |
| 2023 | $7,511 | $687,965 | $187,562 | $500,403 |
| 2022 | $7,401 | $674,477 | $183,885 | $490,592 |
| 2021 | $7,303 | $661,253 | $180,280 | $480,973 |
| 2020 | $6,401 | $580,870 | $158,366 | $422,504 |
| 2019 | $6,204 | $561,228 | $153,011 | $408,217 |
| 2018 | $5,877 | $534,504 | $145,725 | $388,779 |
| 2017 | $5,225 | $499,537 | $136,192 | $363,345 |
| 2016 | $5,204 | $466,858 | $127,283 | $339,575 |
| 2015 | $4,910 | $448,903 | $122,388 | $326,515 |
| 2014 | $4,660 | $440,101 | $119,988 | $320,113 |
Source: Public Records
Map
Nearby Homes
- 692 Humbert St
- 701 Ferrier Way
- 108 Austin Dr
- 682 Diamond Glen Cir
- 448 Gem Smith Place
- 157 Sutcliffe Cir
- 469 Facet Place
- 467 Facet Place
- 503 Diamond Glen Cir
- 631 Rogers Cir
- 656 Silo St
- 510 Diamond Glen Cir
- 1002 Sibley St Unit 25
- 110 Lembi Dr
- 145 Hopfield Dr
- 206 Oxburough Dr
- 0 Figueroa St Unit 225034113
- 617 Wales Dr
- 102 Black Gold Ln
- 104 Hesser Ct
- 691 Larson Way
- 695 Larson Way
- 143 Casselman St
- 145 Casselman St
- 689 Larson Way
- 141 Casselman St
- 697 Larson Way
- 139 Casselman St
- 625 Buchanan Way
- 626 Buchanan Way
- 687 Larson Way
- 699 Larson Way
- 147 Casselman St
- 137 Casselman St
- 682 Larson Way
- 624 Buchanan Way
- 701 Larson Way
- 149 Casselman St
- 142 Casselman St
- 623 Buchanan Way
Your Personal Tour Guide
Ask me questions while you tour the home.