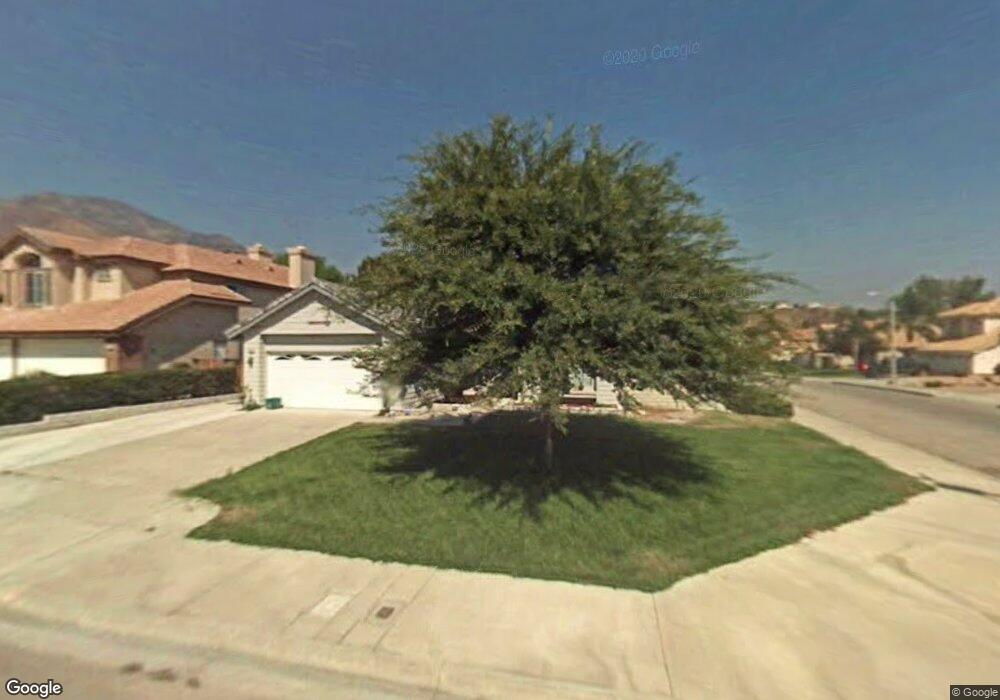
6935 Tiara Ave Highland, CA 92346
East Highlands NeighborhoodEstimated Value: $589,753 - $632,000
3
Beds
2
Baths
1,838
Sq Ft
$332/Sq Ft
Est. Value
About This Home
This home is located at 6935 Tiara Ave, Highland, CA 92346 and is currently estimated at $609,688, approximately $331 per square foot. 6935 Tiara Ave is a home located in San Bernardino County with nearby schools including Highland Grove Elementary School, Beattie Middle School, and Citrus Valley High School.
Ownership History
Date
Name
Owned For
Owner Type
Purchase Details
Closed on
Jan 16, 2026
Sold by
Bassil Loren R and Laura Bassil Trust
Bought by
Loren Rae Bassil Testamentary Trust and Laura Bassil Trust
Current Estimated Value
Purchase Details
Closed on
Nov 19, 2018
Sold by
Bassil Laura
Bought by
Bassil Laura and Bassil Loren R
Purchase Details
Closed on
Jan 13, 2015
Sold by
Bassi Laura
Bought by
Bassil Laura
Home Financials for this Owner
Home Financials are based on the most recent Mortgage that was taken out on this home.
Original Mortgage
$236,000
Interest Rate
3.87%
Mortgage Type
New Conventional
Purchase Details
Closed on
Oct 18, 1996
Sold by
Bassil Raymond
Bought by
Fabela Laura
Home Financials for this Owner
Home Financials are based on the most recent Mortgage that was taken out on this home.
Original Mortgage
$107,200
Interest Rate
8.11%
Purchase Details
Closed on
Aug 6, 1996
Sold by
Cummins Edward J and Cummins Stephanie L
Bought by
Federal National Mortgage Association
Create a Home Valuation Report for This Property
The Home Valuation Report is an in-depth analysis detailing your home's value as well as a comparison with similar homes in the area
Home Values in the Area
Average Home Value in this Area
Purchase History
| Date | Buyer | Sale Price | Title Company |
|---|---|---|---|
| Loren Rae Bassil Testamentary Trust | -- | None Listed On Document | |
| Bassil Laura | -- | None Available | |
| Bassil Laura | -- | Spl Title Services | |
| Fabela Laura | -- | First American Title Ins Co | |
| Fabela Laura | $134,000 | First American Title Ins Co | |
| Federal National Mortgage Association | $122,820 | First Southwestern Title Co |
Source: Public Records
Mortgage History
| Date | Status | Borrower | Loan Amount |
|---|---|---|---|
| Previous Owner | Bassil Laura | $236,000 | |
| Previous Owner | Fabela Laura | $107,200 |
Source: Public Records
Tax History
| Year | Tax Paid | Tax Assessment Tax Assessment Total Assessment is a certain percentage of the fair market value that is determined by local assessors to be the total taxable value of land and additions on the property. | Land | Improvement |
|---|---|---|---|---|
| 2025 | $3,285 | $218,243 | $61,891 | $156,352 |
| 2024 | $3,088 | $213,963 | $60,677 | $153,286 |
| 2023 | $3,079 | $209,767 | $59,487 | $150,280 |
| 2022 | $3,029 | $205,654 | $58,321 | $147,333 |
| 2021 | $3,026 | $201,621 | $57,177 | $144,444 |
| 2020 | $2,967 | $199,554 | $56,591 | $142,963 |
| 2019 | $2,873 | $195,641 | $55,481 | $140,160 |
| 2018 | $2,654 | $191,805 | $54,393 | $137,412 |
| 2017 | $2,377 | $188,044 | $53,326 | $134,718 |
| 2016 | $2,346 | $184,356 | $52,280 | $132,076 |
| 2015 | $2,324 | $181,587 | $51,495 | $130,092 |
| 2014 | $2,279 | $178,030 | $50,486 | $127,544 |
Source: Public Records
Map
Nearby Homes
- 6886 Country Oaks Dr
- 28261 Cornus Ct
- 28046 Millar St
- 27989 Pacific St
- 0 Gala St
- 0 Baseline St Unit CV25136921
- 7354 Harding Ct
- 1634 Seine Ave
- 28929 Davis Ln
- 7135 Highland Spring Ln
- 1614 Buckeye St
- 28999 Clear Spring Ln
- 28237 Kane Ct
- 7079 Cienega Dr
- 7471 Marigold Ave
- 0 La Praix St
- 27631 Villa Ave
- 27611 Villa Ave
- 7001 Church Ave Unit 15
- 28833 Lemon St
- 6927 Tiara Ave
- 28320 Saffron Ave
- 6913 Tiara Ave
- 28332 Saffron Ave
- 28297 Cornus Ct
- 28311 Saffron Ave
- 6912 Country Oaks Dr
- 6905 Tiara Ave
- 28296 Saiga Ct
- 28346 Saffron Ave
- 28323 Saffron Ave
- 6920 Country Oaks Dr
- 28298 Cornus Ct
- 28285 Cornus Ct
- 6897 Tiara Ave
- 6904 Country Oaks Dr
- 28284 Saiga Ct
- 28358 Saffron Ave
- 28335 Saffron Ave
- 28286 Cornus Ct
Your Personal Tour Guide
Ask me questions while you tour the home.