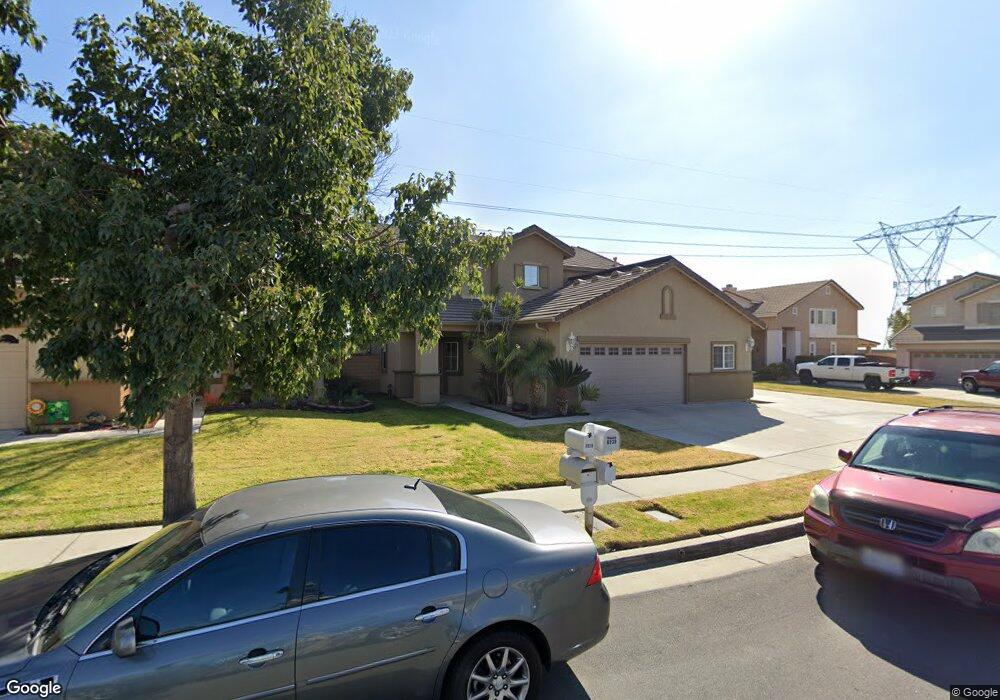
6939 Hillhurst Ct Rancho Cucamonga, CA 91739
Victoria NeighborhoodEstimated Value: $866,000 - $955,000
5
Beds
4
Baths
2,241
Sq Ft
$404/Sq Ft
Est. Value
About This Home
This home is located at 6939 Hillhurst Ct, Rancho Cucamonga, CA 91739 and is currently estimated at $905,157, approximately $403 per square foot. 6939 Hillhurst Ct is a home located in San Bernardino County with nearby schools including Carleton P. Lightfoot Elementary, Day Creek Intermediate, and Rancho Cucamonga High School.
Ownership History
Date
Name
Owned For
Owner Type
Purchase Details
Closed on
Oct 20, 2023
Sold by
Archuleta Michael Anthony and Archuleta Tommie Morle
Bought by
Archuleta Trust and Archuleta
Current Estimated Value
Purchase Details
Closed on
Sep 4, 1998
Sold by
William Lyon Homes Inc
Bought by
Archuleta Michael A and Archuleta Tommie M
Home Financials for this Owner
Home Financials are based on the most recent Mortgage that was taken out on this home.
Original Mortgage
$179,750
Interest Rate
6.88%
Create a Home Valuation Report for This Property
The Home Valuation Report is an in-depth analysis detailing your home's value as well as a comparison with similar homes in the area
Home Values in the Area
Average Home Value in this Area
Purchase History
| Date | Buyer | Sale Price | Title Company |
|---|---|---|---|
| Archuleta Trust | -- | None Listed On Document | |
| Archuleta Michael A | $185,500 | Orange Coast Title |
Source: Public Records
Mortgage History
| Date | Status | Borrower | Loan Amount |
|---|---|---|---|
| Previous Owner | Archuleta Michael A | $179,750 |
Source: Public Records
Tax History Compared to Growth
Tax History
| Year | Tax Paid | Tax Assessment Tax Assessment Total Assessment is a certain percentage of the fair market value that is determined by local assessors to be the total taxable value of land and additions on the property. | Land | Improvement |
|---|---|---|---|---|
| 2025 | $4,408 | $347,595 | $72,671 | $274,924 |
| 2024 | $4,408 | $340,779 | $71,246 | $269,533 |
| 2023 | $4,284 | $334,097 | $69,849 | $264,248 |
| 2022 | $4,210 | $327,546 | $68,479 | $259,067 |
| 2021 | $4,133 | $321,123 | $67,136 | $253,987 |
| 2020 | $4,087 | $317,831 | $66,448 | $251,383 |
| 2019 | $3,990 | $311,599 | $65,145 | $246,454 |
| 2018 | $3,982 | $305,490 | $63,868 | $241,622 |
| 2017 | $3,685 | $287,443 | $62,617 | $224,826 |
| 2016 | $3,585 | $281,807 | $61,389 | $220,418 |
| 2015 | $3,552 | $277,574 | $60,467 | $217,107 |
| 2014 | $3,467 | $272,137 | $59,283 | $212,854 |
Source: Public Records
Map
Nearby Homes
- 11948 Stegmeir Dr
- 6988 Edinburgh Place
- 12164 Wembley Ct
- 7070 Pozallo Place
- 12239 Piccadilly Ct
- 12206 Tunbridge Ct
- 7139 Scalea Place
- 7067 Fontaine Place
- 11959 Huntley Dr
- 12253 Knightsbridge Dr
- 6913 Basswood Place
- 11855 Modena Dr
- 7068 Crocus Ct
- 12325 Bellflower Ct
- 6701 Marsala Place
- 7077 Iris Place
- 12356 Thistle Dr
- 6999 Canosa Place
- 7384 Solstice Place
- 7397 Solstice Place
- 6929 Hillhurst Ct
- 6949 Hillhurst Ct
- 11991 Van Fleet Dr
- 6919 Hillhurst Ct
- 11983 Van Fleet Dr
- 6940 Hillhurst Ct
- 11975 Van Fleet Dr
- 6930 Hillhurst Ct
- 6920 Hillhurst Ct
- 11992 Hunnicutt Dr
- 6973 Dorchester Place
- 11984 Hunnicutt Dr
- 11976 Hunnicutt Dr
- 11967 Van Fleet Dr
- 6939 Montbury Place
- 6929 Montbury Place
- 6919 Montbury Place
- 6979 Dorchester Place
- 11961 Van Fleet Dr
- 11968 Hunnicutt Dr