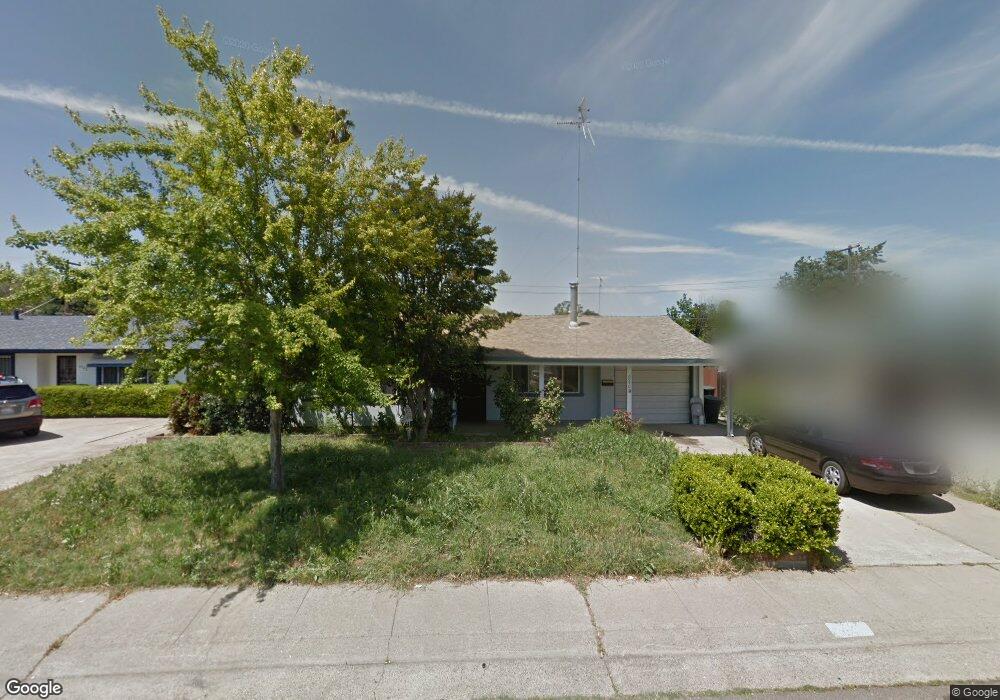
6940 Forman Way Sacramento, CA 95828
Estimated Value: $338,142 - $352,000
3
Beds
1
Bath
958
Sq Ft
$358/Sq Ft
Est. Value
About This Home
This home is located at 6940 Forman Way, Sacramento, CA 95828 and is currently estimated at $342,536, approximately $357 per square foot. 6940 Forman Way is a home located in Sacramento County with nearby schools including Samuel Kennedy Elementary School, James Rutter Middle School, and Florin High School.
Ownership History
Date
Name
Owned For
Owner Type
Purchase Details
Closed on
Jul 22, 2012
Sold by
Chandi Harnek
Bought by
Chandi Harnek and Barpagga Jagtender Kumar
Current Estimated Value
Purchase Details
Closed on
Oct 29, 2009
Sold by
Barpagga Rangi Ram and Barpagga Surjeet Kaur
Bought by
Chandi Harnek
Purchase Details
Closed on
Jul 28, 2005
Sold by
Kajla Hans R and Kajla Surinder R
Bought by
Barpagga Rangi Ram and Barpagga Surjeet Kaur
Home Financials for this Owner
Home Financials are based on the most recent Mortgage that was taken out on this home.
Original Mortgage
$216,000
Interest Rate
1%
Mortgage Type
New Conventional
Purchase Details
Closed on
Jun 8, 2005
Sold by
Wehrhan Alice G
Bought by
Kajla Hans R and Kajla Surinder R
Home Financials for this Owner
Home Financials are based on the most recent Mortgage that was taken out on this home.
Original Mortgage
$216,000
Interest Rate
1%
Mortgage Type
New Conventional
Create a Home Valuation Report for This Property
The Home Valuation Report is an in-depth analysis detailing your home's value as well as a comparison with similar homes in the area
Home Values in the Area
Average Home Value in this Area
Purchase History
| Date | Buyer | Sale Price | Title Company |
|---|---|---|---|
| Chandi Harnek | -- | None Available | |
| Chandi Harnek | $75,000 | Commerce Title Company | |
| Barpagga Rangi Ram | $270,000 | Old Republic Title Company | |
| Kajla Hans R | $230,000 | Old Republic Title Company |
Source: Public Records
Mortgage History
| Date | Status | Borrower | Loan Amount |
|---|---|---|---|
| Previous Owner | Barpagga Rangi Ram | $216,000 | |
| Previous Owner | Kajla Hans R | $184,000 |
Source: Public Records
Tax History Compared to Growth
Tax History
| Year | Tax Paid | Tax Assessment Tax Assessment Total Assessment is a certain percentage of the fair market value that is determined by local assessors to be the total taxable value of land and additions on the property. | Land | Improvement |
|---|---|---|---|---|
| 2025 | $1,841 | $169,228 | $46,610 | $122,618 |
| 2024 | $1,841 | $165,911 | $45,697 | $120,214 |
| 2023 | $1,795 | $162,658 | $44,801 | $117,857 |
| 2022 | $1,765 | $159,470 | $43,923 | $115,547 |
| 2021 | $1,745 | $156,344 | $43,062 | $113,282 |
| 2020 | $1,722 | $154,742 | $42,621 | $112,121 |
| 2019 | $1,691 | $151,709 | $41,786 | $109,923 |
| 2018 | $3,487 | $215,000 | $60,000 | $155,000 |
| 2017 | $962 | $83,411 | $22,242 | $61,169 |
| 2016 | $937 | $81,776 | $21,806 | $59,970 |
| 2015 | $920 | $80,549 | $21,479 | $59,070 |
| 2014 | $906 | $78,972 | $21,059 | $57,913 |
Source: Public Records
Map
Nearby Homes
- 6935 Arvada Ct
- 6955 Lawnwood Dr
- 6912 Richeve Way
- 6916 Farmington Way
- 6757 Rancho Adobe Dr
- 6532 Harley Way
- 6837 Southwood Way
- 6775 Briggs Dr
- 7020 Sunnyslope Dr
- 6690 Hometown Way
- 6724 Capital Dr
- 6990 Chris Ave
- 6719 Representative Way Unit 166
- 7606 Tierra Arbor Way
- 7583 53rd Ave
- 6616 Capital Dr Unit 81
- 6300 Election Ln Unit 118
- 7631 Verna Mae Ave
- 6311 Convention Ln Unit 100
- 6825 Capital Cir Unit 204
- 6936 Forman Way
- 6931 Arvada Ct
- 6929 Arvada Ct
- 6944 Forman Way
- 6932 Forman Way
- 6941 Forman Way
- 6943 Forman Way
- 6937 Forman Way
- 6933 Arvada Ct
- 6925 Peck Dr
- 6928 Forman Way
- 6933 Forman Way
- 6948 Forman Way
- 6945 Forman Way
- 6927 Arvada Ct
- 6923 Peck Dr
- 6929 Forman Way
- 6942 Richman Way
- 6940 Richman Way
- 6924 Forman Way