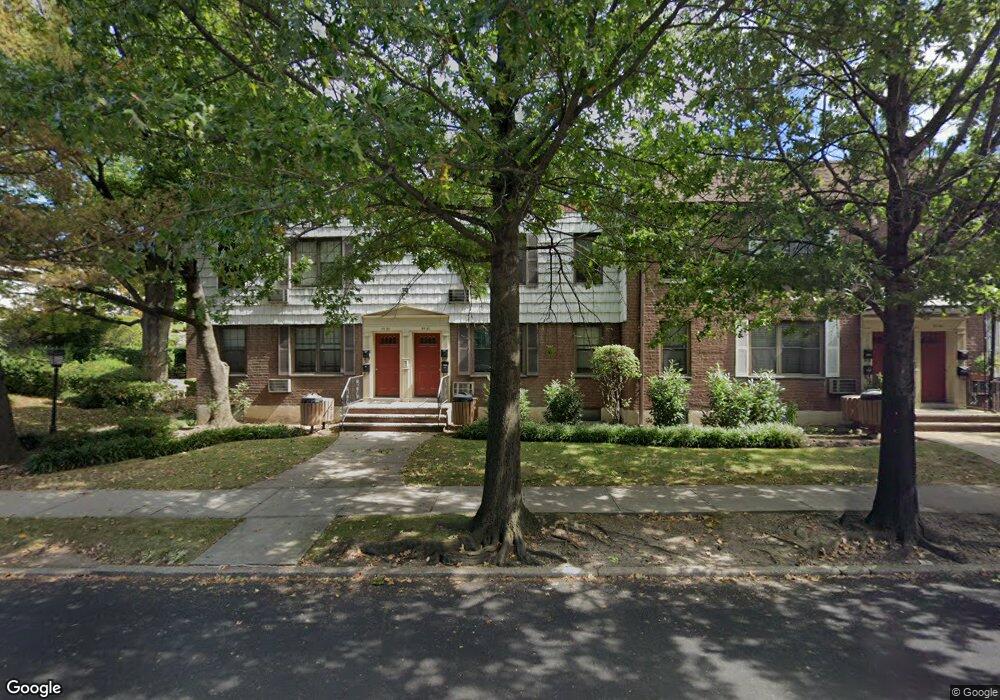
6941 Park Dr E Unit A Flushing, NY 11367
Kew Gardens Hills NeighborhoodEstimated Value: $330,664 - $441,000
Studio
--
Bath
637
Sq Ft
$632/Sq Ft
Est. Value
About This Home
This home is located at 6941 Park Dr E Unit A, Flushing, NY 11367 and is currently estimated at $402,416, approximately $631 per square foot. 6941 Park Dr E Unit A is a home located in Queens County with nearby schools including P.S. 164 - Queens Valley, I.S. 250 - The Robert F. Kennedy Community Middle School, and Bnos Malka Academy.
Ownership History
Date
Name
Owned For
Owner Type
Purchase Details
Closed on
Jun 21, 2019
Sold by
Espaillat Edna and Rivera Edna
Bought by
Rivera Edna and Rivera Jose
Current Estimated Value
Home Financials for this Owner
Home Financials are based on the most recent Mortgage that was taken out on this home.
Original Mortgage
$300,000
Outstanding Balance
$263,239
Interest Rate
4%
Mortgage Type
New Conventional
Estimated Equity
$139,177
Purchase Details
Closed on
Dec 18, 2001
Sold by
Lee Andrew K and Lee Dianna L
Bought by
Espaillat Edna
Home Financials for this Owner
Home Financials are based on the most recent Mortgage that was taken out on this home.
Original Mortgage
$117,560
Interest Rate
7.15%
Mortgage Type
Purchase Money Mortgage
Create a Home Valuation Report for This Property
The Home Valuation Report is an in-depth analysis detailing your home's value as well as a comparison with similar homes in the area
Home Values in the Area
Average Home Value in this Area
Purchase History
| Date | Buyer | Sale Price | Title Company |
|---|---|---|---|
| Rivera Edna | -- | -- | |
| Espaillat Edna | -- | -- |
Source: Public Records
Mortgage History
| Date | Status | Borrower | Loan Amount |
|---|---|---|---|
| Open | Rivera Edna | $300,000 | |
| Previous Owner | Espaillat Edna | $117,560 |
Source: Public Records
Tax History
| Year | Tax Paid | Tax Assessment Tax Assessment Total Assessment is a certain percentage of the fair market value that is determined by local assessors to be the total taxable value of land and additions on the property. | Land | Improvement |
|---|---|---|---|---|
| 2025 | $2,926 | $24,303 | $3,974 | $20,329 |
| 2024 | $2,104 | $23,408 | $3,974 | $19,434 |
| 2023 | $3,030 | $24,233 | $3,974 | $20,259 |
| 2022 | $2,929 | $24,089 | $3,974 | $20,115 |
| 2021 | $2,764 | $22,529 | $3,974 | $18,555 |
| 2020 | $2,762 | $25,409 | $3,974 | $21,435 |
| 2019 | $2,599 | $24,663 | $3,974 | $20,689 |
| 2018 | $2,446 | $19,233 | $3,974 | $15,259 |
| 2017 | $2,333 | $18,342 | $3,974 | $14,368 |
| 2016 | $2,288 | $18,342 | $3,974 | $14,368 |
| 2015 | $1,251 | $16,977 | $3,975 | $13,002 |
| 2014 | $1,251 | $16,153 | $3,963 | $12,190 |
Source: Public Records
Map
Nearby Homes
- 135-02 Jewel Ave Unit A
- 68-76 136th St Unit A
- 68-76 136th St Unit B
- 135-23 Jewel Ave Unit A
- 70-07 Park Dr E Unit A
- 6860 136th St Unit A
- 70-43B Park Dr E
- 6951 136th St Unit 2A
- 70-47 Park Dr E Unit A
- 68-38 136th St Unit A
- 69-92 136th St Unit A
- 7107 Park Dr E Unit B
- 71-17 Park Dr E Unit B
- 67-47 136th St Unit A
- 6912 138th St Unit B
- 6703 136th St Unit B
- 138-01A Jewel Ave Unit 1A
- 66-15 Park Dr E Unit B
- 71-43 Park Dr E Unit A
- 138-29 Jewel Ave Unit 3D
- 6943 Park Dr E Unit B
- 6943 Park Dr E Unit A
- 6941 Park Dr E Unit B
- 6941 Park Dr E Unit B
- 6943 Park Dr E Unit A
- 6943 Park Dr E
- 6939 Park Dr E Unit B
- 6939 Park Dr E Unit A
- 6939 Park Dr E
- 6939 Park Dr E Unit A
- 6939 Park Dr E Unit 1A
- 69-47B Park Dr E Unit B
- 6947 Park Dr E Unit B
- 6947A Park Dr E Unit A
- 6945 Park Dr E Unit B
- 6945 Park Dr E Unit A
- 6947 Park Dr E
- 69-47A Park Dr E Unit A
- 13404 Jewel Ave Unit 2L
- 13404 Jewel Ave Unit A
Your Personal Tour Guide
Ask me questions while you tour the home.