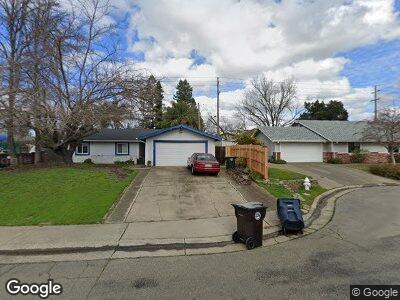
6949 Sylvan Glen Way Citrus Heights, CA 95610
Sylvan Old Auburn Road NeighborhoodEstimated Value: $568,000 - $675,000
4
Beds
3
Baths
2,209
Sq Ft
$286/Sq Ft
Est. Value
About This Home
This home is located at 6949 Sylvan Glen Way, Citrus Heights, CA 95610 and is currently estimated at $631,130, approximately $285 per square foot. 6949 Sylvan Glen Way is a home located in Sacramento County with nearby schools including Carriage Drive Elementary School, Sylvan Middle School, and Mesa Verde High School.
Ownership History
Date
Name
Owned For
Owner Type
Purchase Details
Closed on
May 18, 2012
Sold by
Rozak David W and Rozak Jeanne M
Bought by
Rozak David W and Rozak Jeanne M
Current Estimated Value
Home Financials for this Owner
Home Financials are based on the most recent Mortgage that was taken out on this home.
Original Mortgage
$342,000
Outstanding Balance
$246,328
Interest Rate
3.85%
Mortgage Type
New Conventional
Estimated Equity
$376,845
Purchase Details
Closed on
Oct 4, 2005
Sold by
Rozak David W and Rozak Jeanne M
Bought by
Rozak David W and Rozak Jeanne M
Purchase Details
Closed on
Jun 25, 1998
Sold by
Washington Mutual Bank Fa
Bought by
Rozak David W and Rozak Jeanne M
Home Financials for this Owner
Home Financials are based on the most recent Mortgage that was taken out on this home.
Original Mortgage
$145,800
Interest Rate
7.06%
Purchase Details
Closed on
Feb 24, 1998
Sold by
Erickson Paul R and Erickson Jill R
Bought by
Washington Mutual Bank Fa and American Svgs Bank Fa
Create a Home Valuation Report for This Property
The Home Valuation Report is an in-depth analysis detailing your home's value as well as a comparison with similar homes in the area
Home Values in the Area
Average Home Value in this Area
Purchase History
| Date | Buyer | Sale Price | Title Company |
|---|---|---|---|
| Rozak David W | -- | Placer Title Company | |
| Rozak David W | -- | -- | |
| Rozak David W | $162,000 | Old Republic Title Company | |
| Washington Mutual Bank Fa | $163,319 | First American Title Ins Co |
Source: Public Records
Mortgage History
| Date | Status | Borrower | Loan Amount |
|---|---|---|---|
| Open | Rozak David W | $342,000 | |
| Closed | Rozak David W | $337,600 | |
| Closed | Rozak David W | $42,160 | |
| Closed | Rozak David W | $130,000 | |
| Closed | Rozak David W | $180,000 | |
| Closed | Rozak David W | $144,600 | |
| Closed | Rozak David W | $145,800 |
Source: Public Records
Tax History Compared to Growth
Tax History
| Year | Tax Paid | Tax Assessment Tax Assessment Total Assessment is a certain percentage of the fair market value that is determined by local assessors to be the total taxable value of land and additions on the property. | Land | Improvement |
|---|---|---|---|---|
| 2024 | $2,916 | $248,966 | $61,466 | $187,500 |
| 2023 | $2,840 | $244,085 | $60,261 | $183,824 |
| 2022 | $2,823 | $239,300 | $59,080 | $180,220 |
| 2021 | $2,775 | $234,609 | $57,922 | $176,687 |
| 2020 | $2,723 | $232,205 | $57,329 | $174,876 |
| 2019 | $2,666 | $227,653 | $56,205 | $171,448 |
| 2018 | $2,634 | $223,190 | $55,103 | $168,087 |
| 2017 | $2,607 | $218,815 | $54,023 | $164,792 |
| 2016 | $2,433 | $214,525 | $52,964 | $161,561 |
| 2015 | $2,391 | $211,304 | $52,169 | $159,135 |
| 2014 | $2,339 | $207,166 | $51,148 | $156,018 |
Source: Public Records
Map
Nearby Homes
- 7401 Mariposa Ave
- 6903 Maddie Mae Ln
- 6912 Sylvan Rd
- 6740 Rinconada Dr
- 7731 Spring Valley Ave
- 7131 Maretha St
- 6935 W Oak Ct
- 7150 Bonita Way
- 7069 Lynnetree Way
- 7569 Circuit Dr
- 7337 Chivalry Way
- 6520 Farr Ct
- 6515 Mariposa Ave
- 6449 Feliciter Way
- 7037 Lynnetree Way
- 7864 Sunrise Terrace Ln
- 7668 Cook Ave
- 7852 Beaupre Way
- 6720 Wyatt Cir
- 7311 Hera Way
- 6949 Sylvan Glen Way
- 6945 Sylvan Glen Way
- 6965 Mariposa Ave
- 7628 Prince St
- 6946 Sylvan Glen Way
- 7624 Prince St
- 7632 Prince St
- 7620 Prince St
- 6963 Mariposa Ave
- 6941 Sylvan Glen Way
- 6967 Mariposa Ave
- 7654 Prince St
- 7616 Prince St
- 6940 Sylvan Glen Way
- 7636 Prince St
- 6924 Sylvan Glen Way
- 6937 Sylvan Glen Way
- 7612 Prince St
- 6953 Mariposa Ave
- 6920 Sylvan Glen Way