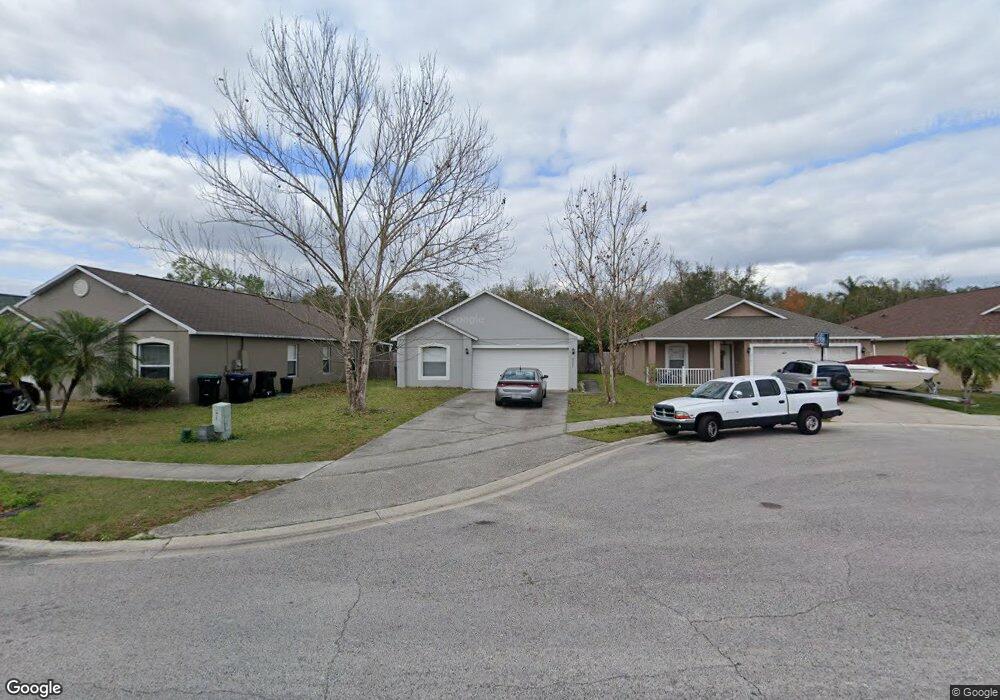
6957 Kelcher Ct Orlando, FL 32807
Estimated Value: $337,000 - $369,000
3
Beds
2
Baths
1,680
Sq Ft
$207/Sq Ft
Est. Value
About This Home
This home is located at 6957 Kelcher Ct, Orlando, FL 32807 and is currently estimated at $347,289, approximately $206 per square foot. 6957 Kelcher Ct is a home located in Orange County with nearby schools including Forsyth Woods Elementary School, Roberto Clemente Middle School, and Colonial High School.
Ownership History
Date
Name
Owned For
Owner Type
Purchase Details
Closed on
Nov 3, 2015
Sold by
Freo Florida Llc
Bought by
Progress Residential 2015-3 Borrower Llc
Current Estimated Value
Purchase Details
Closed on
Feb 27, 2015
Sold by
Gonzalez Efren and Lugo Adalys
Bought by
Freo Florida Llc
Purchase Details
Closed on
Feb 4, 2015
Sold by
Nationwide Group Llc
Bought by
Rodriguez Nancy and Jauregui Alejandro
Purchase Details
Closed on
Jul 19, 2003
Sold by
Canales Abraham and Canales Iritza
Bought by
Gonzalez Efren and Lugo Adalys
Purchase Details
Closed on
Jan 24, 2001
Sold by
Maronda Homes Inc Of Florida
Bought by
Canales Abraham and Canales Iritza
Home Financials for this Owner
Home Financials are based on the most recent Mortgage that was taken out on this home.
Original Mortgage
$93,865
Interest Rate
7.44%
Mortgage Type
FHA
Create a Home Valuation Report for This Property
The Home Valuation Report is an in-depth analysis detailing your home's value as well as a comparison with similar homes in the area
Home Values in the Area
Average Home Value in this Area
Purchase History
| Date | Buyer | Sale Price | Title Company |
|---|---|---|---|
| Progress Residential 2015-3 Borrower Llc | -- | Attorney | |
| Freo Florida Llc | $121,000 | Hometown Title Group | |
| Rodriguez Nancy | $119,500 | Hometown Title Group Inc | |
| Gonzalez Efren | -- | -- | |
| Canales Abraham | $94,000 | -- |
Source: Public Records
Mortgage History
| Date | Status | Borrower | Loan Amount |
|---|---|---|---|
| Previous Owner | Canales Abraham | $93,865 |
Source: Public Records
Tax History Compared to Growth
Tax History
| Year | Tax Paid | Tax Assessment Tax Assessment Total Assessment is a certain percentage of the fair market value that is determined by local assessors to be the total taxable value of land and additions on the property. | Land | Improvement |
|---|---|---|---|---|
| 2025 | $4,853 | $307,190 | $55,000 | $252,190 |
| 2024 | $4,474 | $285,313 | -- | -- |
| 2023 | $4,474 | $298,864 | $55,000 | $243,864 |
| 2022 | $4,006 | $259,995 | $55,000 | $204,995 |
| 2021 | $3,543 | $208,875 | $45,000 | $163,875 |
| 2020 | $3,134 | $188,223 | $38,000 | $150,223 |
| 2019 | $3,160 | $189,381 | $38,000 | $151,381 |
| 2018 | $2,822 | $155,999 | $22,000 | $133,999 |
| 2017 | $2,688 | $152,467 | $22,000 | $130,467 |
| 2016 | $2,450 | $126,080 | $22,000 | $104,080 |
| 2015 | $2,007 | $120,715 | $22,000 | $98,715 |
| 2014 | $1,791 | $95,726 | $22,000 | $73,726 |
Source: Public Records
Map
Nearby Homes
- 777 Penlon Ct
- 690 N Forsyth Rd
- 519 Beasley Ct
- 7525 Azalea Cove Cir
- 7557 Azalea Cove Cir
- 7358 Azalea Cove Cir
- 600 Dee St
- 7338 Azalea Cove Cir
- 367 Southern Charm Dr
- 1149 Rich Moor Cir
- 460 Southern Charm Dr
- Coba Plan at Yucatan Gardens
- Merida Plan at Yucatan Gardens
- Tulum Plan at Yucatan Gardens
- Uman Plan at Yucatan Gardens
- 106 Elena Lavin Cir Unit 16
- 106 Elena Lavin Cir Unit 19
- 31 Cosmos Dr
- 100 Elena Lavin Cir Unit 39
- 100 Elena Lavin Cir Unit 38
- 6951 Kelcher Ct
- 6963 Kelcher Ct
- 6969 Kelcher Ct
- 6945 Kelcher Ct
- 6975 Kelcher Ct
- 6939 Kelcher Ct
- 6982 Kelcher Ct
- 6958 Kelcher Ct
- 6964 Kelcher Ct
- 6970 Kelcher Ct
- 6952 Kelcher Ct
- 6933 Kelcher Ct
- 6976 Kelcher Ct
- 6946 Kelcher Ct
- 6927 Kelcher Ct
- 6940 Kelcher Ct
- 6934 Kelcher Ct
- 6921 Kelcher Ct
- 6928 Kelcher Ct
- 664 Caladesi Trail