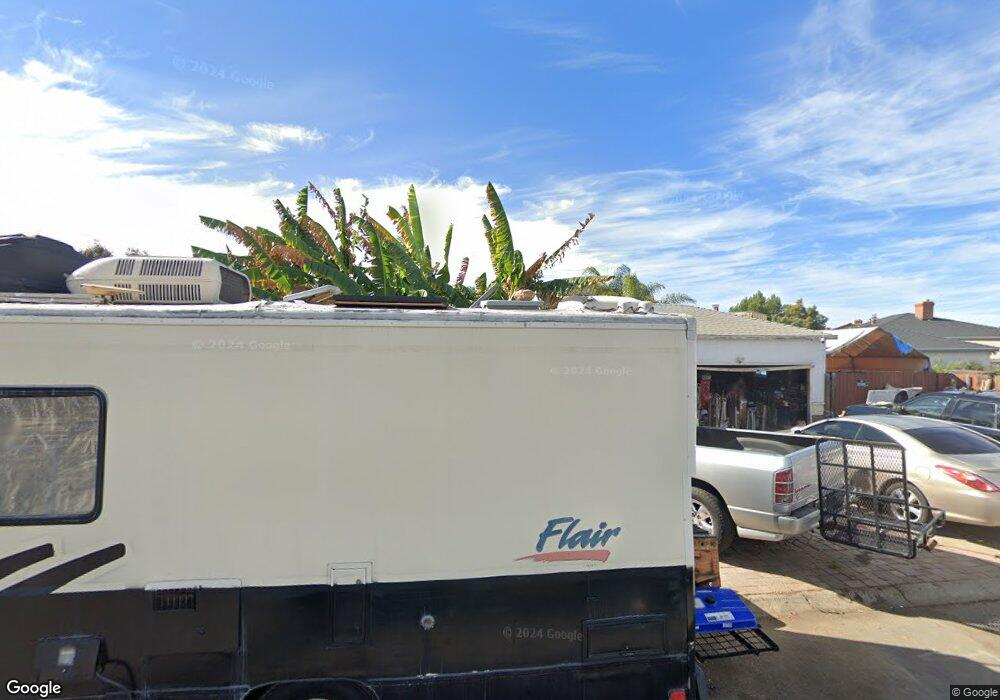
696 J Esplanade Chula Vista, CA 91910
Downtown Chula Vista NeighborhoodEstimated Value: $458,000 - $641,000
2
Beds
1
Bath
945
Sq Ft
$574/Sq Ft
Est. Value
About This Home
This home is located at 696 J Esplanade, Chula Vista, CA 91910 and is currently estimated at $542,725, approximately $574 per square foot. 696 J Esplanade is a home located in San Diego County with nearby schools including Chula Vista Middle School, Chula Vista High School, and Mueller Charter School.
Ownership History
Date
Name
Owned For
Owner Type
Purchase Details
Closed on
Aug 22, 2024
Sold by
Robert K Sobke Revocable Living Trust and Sobke Tara
Bought by
Rock West-Big Bear Properties
Current Estimated Value
Purchase Details
Closed on
Jun 21, 2024
Sold by
Sobke Robert K
Bought by
Robert K Sobke Revocable Living Trust
Purchase Details
Closed on
Dec 15, 2008
Sold by
Sobke Catherine Mary
Bought by
Sobke Robert Kirk
Home Financials for this Owner
Home Financials are based on the most recent Mortgage that was taken out on this home.
Original Mortgage
$67,000
Interest Rate
4.71%
Mortgage Type
Seller Take Back
Purchase Details
Closed on
Oct 27, 2006
Sold by
Sobke Catherine M
Bought by
Sobke Robert Kirk and Sobke Elizabeth
Purchase Details
Closed on
Dec 9, 1998
Sold by
Sobke Fredrick H
Bought by
Sobke Fredrick H and Sobke Alfa
Create a Home Valuation Report for This Property
The Home Valuation Report is an in-depth analysis detailing your home's value as well as a comparison with similar homes in the area
Home Values in the Area
Average Home Value in this Area
Purchase History
| Date | Buyer | Sale Price | Title Company |
|---|---|---|---|
| Rock West-Big Bear Properties | $450,000 | Wfg National Title Company | |
| Robert K Sobke Revocable Living Trust | -- | None Listed On Document | |
| Sobke Robert Kirk | -- | None Available | |
| Sobke Catherine Mary | -- | None Available | |
| Sobke Robert Kirk | -- | None Available | |
| Sobke Fredrick H | -- | -- | |
| Sobke Fredrick H | -- | -- |
Source: Public Records
Mortgage History
| Date | Status | Borrower | Loan Amount |
|---|---|---|---|
| Previous Owner | Sobke Catherine Mary | $67,000 |
Source: Public Records
Tax History Compared to Growth
Tax History
| Year | Tax Paid | Tax Assessment Tax Assessment Total Assessment is a certain percentage of the fair market value that is determined by local assessors to be the total taxable value of land and additions on the property. | Land | Improvement |
|---|---|---|---|---|
| 2025 | $698 | $570,000 | $500,000 | $70,000 |
| 2024 | $698 | $56,799 | $28,060 | $28,739 |
| 2023 | $688 | $55,686 | $27,510 | $28,176 |
| 2022 | $668 | $54,595 | $26,971 | $27,624 |
| 2021 | $654 | $53,526 | $26,443 | $27,083 |
| 2020 | $639 | $52,978 | $26,172 | $26,806 |
| 2019 | $623 | $51,940 | $25,659 | $26,281 |
| 2018 | $613 | $50,922 | $25,156 | $25,766 |
| 2017 | $600 | $49,924 | $24,663 | $25,261 |
| 2016 | $585 | $48,946 | $24,180 | $24,766 |
| 2015 | $577 | $48,211 | $23,817 | $24,394 |
| 2014 | $569 | $47,268 | $23,351 | $23,917 |
Source: Public Records
Map
Nearby Homes
- 685 Jefferson Ave
- 766 Madison Ave Unit A B
- 622 I St
- 786 Madison Ave
- 658 Cedar Ave
- 776 Oaklawn Ave
- 587 Jefferson Ave
- 657 Sierra Way
- 866 Oaklawn Ave
- 708 H St Unit 7
- 708 H St Unit 25
- 708 H St Unit 21
- 708 H St Unit 64
- 708 H St Unit 35
- Plan1 at Citrus Bay - The Courts
- Plan 2 at Citrus Bay - The Courts
- Plan 3 at Citrus Bay - The Courts
- Plan 6 at Citrus Bay - The Towns
- Plan 4 at Citrus Bay - The Towns
- Plan 2 at Citrus Bay - The Towns