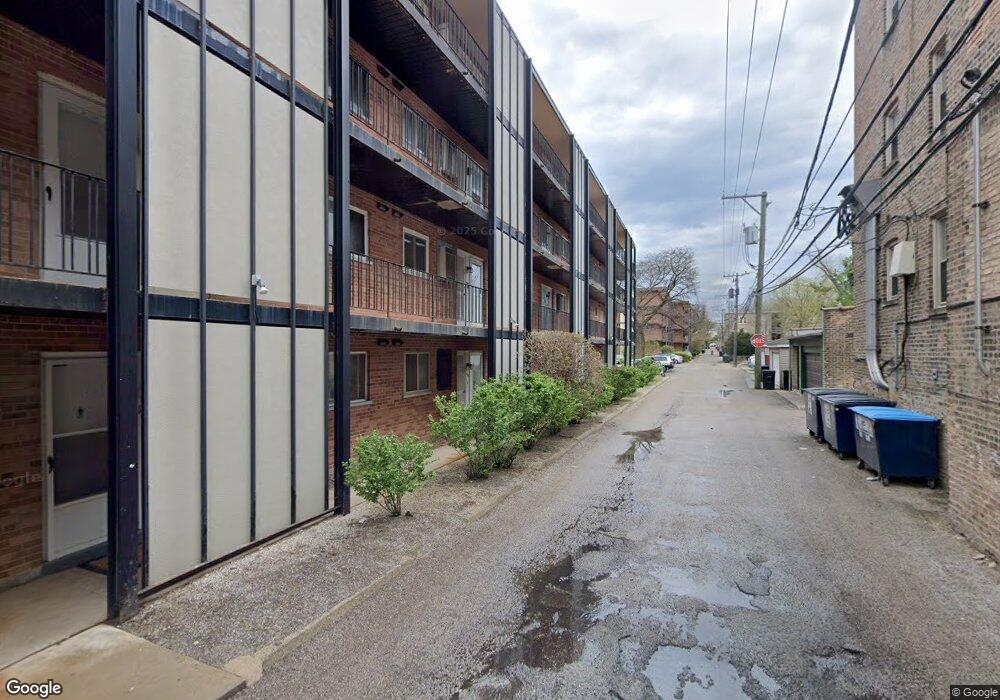
6961 N Oakley Ave Unit 205 Chicago, IL 60645
West Ridge NeighborhoodEstimated Value: $140,000 - $185,000
1
Bed
1
Bath
686
Sq Ft
$234/Sq Ft
Est. Value
About This Home
This home is located at 6961 N Oakley Ave Unit 205, Chicago, IL 60645 and is currently estimated at $160,388, approximately $233 per square foot. 6961 N Oakley Ave Unit 205 is a home located in Cook County with nearby schools including George Armstrong Elementary School, Sullivan High School, and God's Battle Axe Prayer Academy.
Ownership History
Date
Name
Owned For
Owner Type
Purchase Details
Closed on
Mar 7, 2022
Sold by
Tsvetanov Lyubomir B and Tsvetanov Milena Ivanova
Bought by
Petkov Dimitar
Current Estimated Value
Purchase Details
Closed on
Nov 1, 2010
Sold by
Federal Home Loan Mortgage Corporation
Bought by
Tsvetanov Lyubomir B
Purchase Details
Closed on
May 27, 2010
Sold by
Keranovic Asmir
Bought by
Federal Home Loan Mortgage Corp
Purchase Details
Closed on
Oct 9, 2003
Sold by
Korycan Herman and Korycan Cecilie M
Bought by
Keranovic Asima and Keranovic Asmir
Home Financials for this Owner
Home Financials are based on the most recent Mortgage that was taken out on this home.
Original Mortgage
$123,405
Interest Rate
6.01%
Mortgage Type
Unknown
Create a Home Valuation Report for This Property
The Home Valuation Report is an in-depth analysis detailing your home's value as well as a comparison with similar homes in the area
Home Values in the Area
Average Home Value in this Area
Purchase History
| Date | Buyer | Sale Price | Title Company |
|---|---|---|---|
| Petkov Dimitar | -- | None Listed On Document | |
| Petkov Dimitar | -- | -- | |
| Tsvetanov Lyubomir B | $30,000 | Attorneys Title Guaranty Fun | |
| Federal Home Loan Mortgage Corp | -- | None Available | |
| Keranovic Asima | $130,000 | Atgf Inc |
Source: Public Records
Mortgage History
| Date | Status | Borrower | Loan Amount |
|---|---|---|---|
| Previous Owner | Keranovic Asima | $123,405 |
Source: Public Records
Tax History Compared to Growth
Tax History
| Year | Tax Paid | Tax Assessment Tax Assessment Total Assessment is a certain percentage of the fair market value that is determined by local assessors to be the total taxable value of land and additions on the property. | Land | Improvement |
|---|---|---|---|---|
| 2024 | $1,410 | $11,578 | $1,865 | $9,713 |
| 2023 | $1,353 | $10,000 | $1,492 | $8,508 |
| 2022 | $1,353 | $10,000 | $1,492 | $8,508 |
| 2021 | $1,341 | $9,999 | $1,492 | $8,507 |
| 2020 | $686 | $6,181 | $1,409 | $4,772 |
| 2019 | $688 | $6,856 | $1,409 | $5,447 |
| 2018 | $676 | $6,856 | $1,409 | $5,447 |
| 2017 | $583 | $6,082 | $1,243 | $4,839 |
| 2016 | $718 | $6,082 | $1,243 | $4,839 |
| 2015 | $634 | $6,082 | $1,243 | $4,839 |
| 2014 | $747 | $6,592 | $1,119 | $5,473 |
| 2013 | $721 | $6,592 | $1,119 | $5,473 |
Source: Public Records
Map
Nearby Homes
- 6960 N Bell Ave Unit 208
- 2302 W Farwell Ave Unit 1
- 2245 W Farwell Ave Unit 3B
- 2300 W Farwell Ave Unit 3
- 2300 W Farwell Ave Unit 2
- 2130 W Farwell Ave
- 2217 W Farwell Ave Unit 3B
- 2217 W Farwell Ave Unit 2B
- 2241 W Farwell Ave Unit 2D
- 6827 N Oakley Ave Unit 3C
- 2243 W Farwell Ave Unit 3D
- 2322 W Farwell Ave Unit 1W
- 6957 N Hamilton Ave
- 2101 W Greenleaf Ave
- 2416 W Morse Ave
- 2036 W Morse Ave Unit D
- 2065 W Farwell Ave Unit 20653N
- 7070 N Ridge Blvd Unit 1A
- 7129 N Oakley Ave
- 2175 W Touhy Ave
- 6961 N Oakley Ave Unit 208
- 6961 N Oakley Ave Unit 106
- 6961 N Oakley Ave Unit 106
- 6961 N Oakley Ave Unit 105
- 6961 N Oakley Ave Unit 203
- 6961 N Oakley Ave Unit 202
- 6961 N Oakley Ave Unit 403
- 6961 N Oakley Ave Unit 107
- 6961 N Oakley Ave Unit 210
- 6961 N Oakley Ave Unit 201
- 6961 N Oakley Ave Unit 406
- 6961 N Oakley Ave Unit 402
- 6961 N Oakley Ave Unit 307
- 6961 N Oakley Ave Unit 308
- 6961 N Oakley Ave Unit 101
- 6961 N Oakley Ave Unit 401
- 6961 N Oakley Ave Unit 301
- 6961 N Oakley Ave Unit 209
- 6961 N Oakley Ave Unit 305
- 6961 N Oakley Ave Unit 110