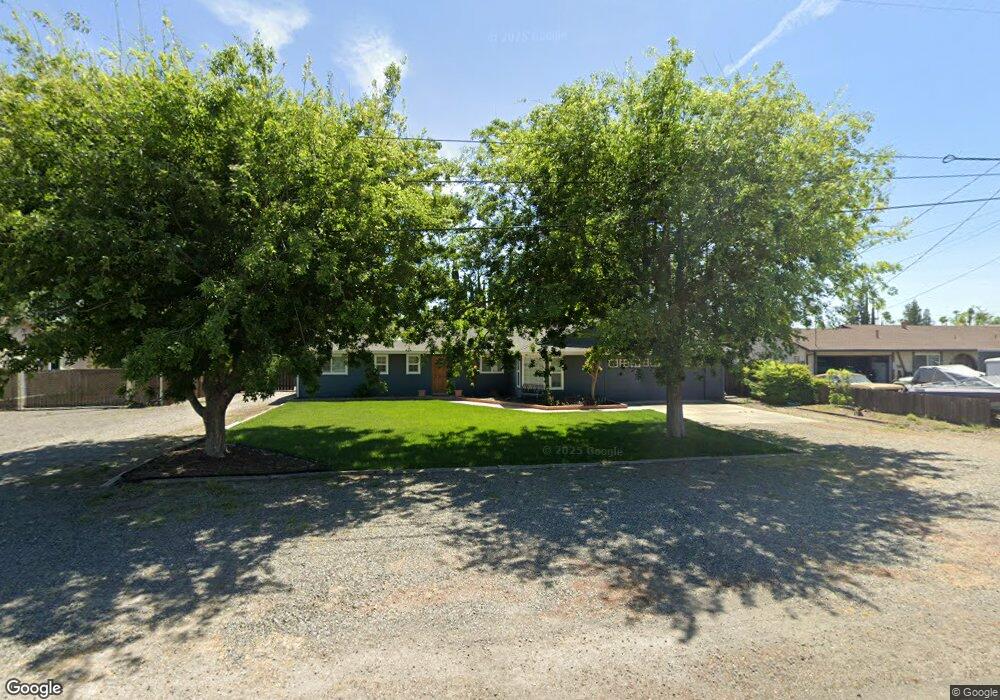
6966 Sutter Ave Sutter, CA 95982
Estimated Value: $376,022 - $434,000
3
Beds
2
Baths
1,268
Sq Ft
$319/Sq Ft
Est. Value
About This Home
This home is located at 6966 Sutter Ave, Sutter, CA 95982 and is currently estimated at $404,006, approximately $318 per square foot. 6966 Sutter Ave is a home located in Sutter County with nearby schools including Brittan Elementary School, Sutter High School, and Christian Outreach Fellowship.
Ownership History
Date
Name
Owned For
Owner Type
Purchase Details
Closed on
May 6, 2014
Sold by
Rupert Brad
Bought by
Rupert Brad and Rupert Briauna
Current Estimated Value
Purchase Details
Closed on
Oct 12, 2012
Sold by
Rupert Brad and Rupert Djuana
Bought by
Rupert Brad
Home Financials for this Owner
Home Financials are based on the most recent Mortgage that was taken out on this home.
Original Mortgage
$202,312
Outstanding Balance
$139,101
Interest Rate
3.36%
Mortgage Type
New Conventional
Estimated Equity
$264,905
Purchase Details
Closed on
Oct 31, 2003
Sold by
Woods Russell C and Woods Patrice
Bought by
Rupert Brad and Rupert Djuana
Home Financials for this Owner
Home Financials are based on the most recent Mortgage that was taken out on this home.
Original Mortgage
$223,800
Interest Rate
5.94%
Mortgage Type
Purchase Money Mortgage
Create a Home Valuation Report for This Property
The Home Valuation Report is an in-depth analysis detailing your home's value as well as a comparison with similar homes in the area
Home Values in the Area
Average Home Value in this Area
Purchase History
| Date | Buyer | Sale Price | Title Company |
|---|---|---|---|
| Rupert Brad | -- | None Available | |
| Rupert Brad | -- | None Available | |
| Rupert Brad | $224,000 | Placer Title Company |
Source: Public Records
Mortgage History
| Date | Status | Borrower | Loan Amount |
|---|---|---|---|
| Open | Rupert Brad | $202,312 | |
| Closed | Rupert Brad | $223,800 |
Source: Public Records
Tax History
| Year | Tax Paid | Tax Assessment Tax Assessment Total Assessment is a certain percentage of the fair market value that is determined by local assessors to be the total taxable value of land and additions on the property. | Land | Improvement |
|---|---|---|---|---|
| 2025 | $3,312 | $318,175 | $92,406 | $225,769 |
| 2024 | $3,312 | $311,938 | $90,595 | $221,343 |
| 2023 | $3,312 | $305,822 | $88,819 | $217,003 |
| 2022 | $3,219 | $299,827 | $87,078 | $212,749 |
| 2021 | $3,188 | $293,963 | $85,378 | $208,585 |
| 2020 | $3,147 | $290,949 | $84,503 | $206,446 |
| 2019 | $3,296 | $285,245 | $82,846 | $202,399 |
| 2018 | $2,783 | $235,600 | $65,000 | $170,600 |
| 2017 | $2,288 | $197,300 | $56,700 | $140,600 |
| 2016 | $2,213 | $187,920 | $54,000 | $133,920 |
| 2015 | $2,065 | $174,000 | $50,000 | $124,000 |
| 2014 | $1,845 | $153,000 | $40,000 | $113,000 |
Source: Public Records
Map
Nearby Homes
- 2371 Elm St
- 2431 Madrone St
- 7669 Barrow St
- 2227 W Ridge Dr
- 2211 W Ridge Dr
- 2185 Perry St
- 1939 1st Ave
- 8617 S Butte Rd
- 1244 Acacia Ave
- 5576 S Butte Rd
- 8454 Pass Rd
- 8970 S Butte Rd
- 2065 Howlett Ave
- 4423 Dresser Rd
- 4361 Dresser Rd
- 1270 Tulio St
- 1803 Lynchburg Dr
- 3295 Jefferson Ave
- 3327 Sam Brannan Way
- 2127 Pepperwood Dr
- 6930 Sutter Ave
- 6980 Sutter Ave
- 6880 Sutter Ave
- 6959 Sutter Ave
- 6925 Sutter Ave
- 6971 Sutter Ave
- 2496 Locust St Unit 1
- 2496 Locust St
- 2470 Locust St
- 6850 Sutter Ave
- 2454 Locust St
- 6849 Sutter Ave
- 2554 Cedar St
- 2444 Locust St
- 2553 Locust St
- 2518 Locust St
- 2424 Locust St
- 6835 Sutter Ave Unit 1
- 6835 Sutter Ave
- 6830 Sutter Ave
Your Personal Tour Guide
Ask me questions while you tour the home.