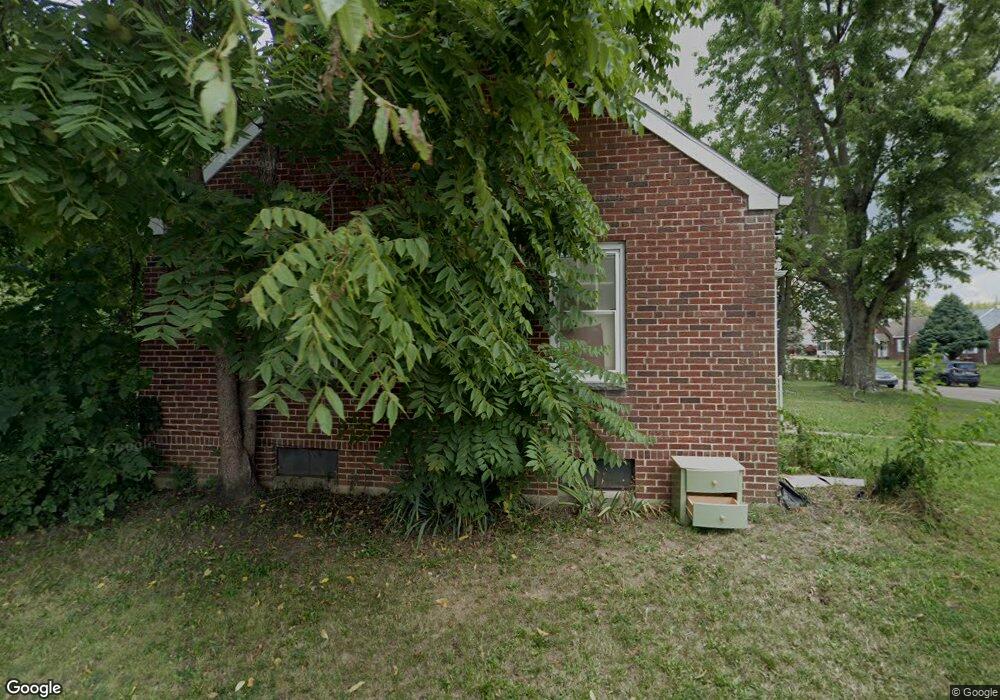
697 Butler Ave Columbus, OH 43223
South Hilltop NeighborhoodEstimated Value: $123,000 - $163,000
2
Beds
1
Bath
1,054
Sq Ft
$134/Sq Ft
Est. Value
About This Home
This home is located at 697 Butler Ave, Columbus, OH 43223 and is currently estimated at $141,346, approximately $134 per square foot. 697 Butler Ave is a home located in Franklin County with nearby schools including West Mound Elementary School, Hilltonia Middle School, and Briggs High School.
Ownership History
Date
Name
Owned For
Owner Type
Purchase Details
Closed on
Mar 6, 2018
Sold by
Fisher Randy L
Bought by
697 Butler Avenue Llc
Current Estimated Value
Purchase Details
Closed on
May 26, 2010
Sold by
Williams Christopher S and Williams Kimberly
Bought by
Fisher Randy L
Purchase Details
Closed on
Apr 8, 2008
Sold by
Williams Christine K
Bought by
Williams Christopher S
Home Financials for this Owner
Home Financials are based on the most recent Mortgage that was taken out on this home.
Original Mortgage
$55,250
Interest Rate
6.09%
Mortgage Type
New Conventional
Purchase Details
Closed on
Nov 30, 2006
Sold by
Parrill Frances L
Bought by
Williams Christopher S and Williams Christine K
Home Financials for this Owner
Home Financials are based on the most recent Mortgage that was taken out on this home.
Original Mortgage
$50,040
Interest Rate
6.4%
Mortgage Type
Purchase Money Mortgage
Purchase Details
Closed on
Jan 7, 1987
Bought by
Parrill Frances L
Create a Home Valuation Report for This Property
The Home Valuation Report is an in-depth analysis detailing your home's value as well as a comparison with similar homes in the area
Home Values in the Area
Average Home Value in this Area
Purchase History
| Date | Buyer | Sale Price | Title Company |
|---|---|---|---|
| 697 Butler Avenue Llc | -- | Land & Mortgage Title Agency | |
| Fisher Randy L | $23,000 | Hostetler | |
| Williams Christopher S | -- | Attorney | |
| Williams Christopher S | $55,600 | Ohio Title | |
| Parrill Frances L | $38,500 | -- |
Source: Public Records
Mortgage History
| Date | Status | Borrower | Loan Amount |
|---|---|---|---|
| Previous Owner | Williams Christopher S | $55,250 | |
| Previous Owner | Williams Christopher S | $50,040 |
Source: Public Records
Tax History
| Year | Tax Paid | Tax Assessment Tax Assessment Total Assessment is a certain percentage of the fair market value that is determined by local assessors to be the total taxable value of land and additions on the property. | Land | Improvement |
|---|---|---|---|---|
| 2025 | $1,631 | $35,600 | $5,710 | $29,890 |
| 2024 | $1,631 | $35,600 | $5,710 | $29,890 |
| 2023 | $1,611 | $35,595 | $5,705 | $29,890 |
| 2022 | $975 | $18,340 | $1,960 | $16,380 |
| 2021 | $1,586 | $18,340 | $1,960 | $16,380 |
| 2020 | $988 | $18,340 | $1,960 | $16,380 |
| 2019 | $936 | $15,050 | $1,610 | $13,440 |
| 2018 | $467 | $15,050 | $1,610 | $13,440 |
| 2017 | $936 | $15,050 | $1,610 | $13,440 |
| 2016 | $1,201 | $16,490 | $4,310 | $12,180 |
| 2015 | $510 | $16,490 | $4,310 | $12,180 |
| 2014 | $1,022 | $16,490 | $4,310 | $12,180 |
| 2013 | $593 | $19,390 | $5,075 | $14,315 |
Source: Public Records
Map
Nearby Homes
- 780-782 Whitethorne Ave
- 2182 Homewood Ave
- 624 Wrexham Ave
- 822-840 Whitethorne Ave Unit 822
- 561 Belvidere Ave
- 632 Hilltonia Ave
- 2247 Safford Ave
- 530 Whitethorne Ave
- 543 Hilltonia Ave
- 510 Belvidere Ave
- 608 Nashoba Ave
- 485 Belvidere Ave
- 1543 Safford Ave
- 911 Clarendon Ave
- 573 S Highland Ave
- 637 S Wheatland Ave Unit 639
- 629 S Wheatland Ave Unit 631
- 545-547 S Highland Ave Unit 545
- 479 Nashoba Ave
- 2023 Sullivant Ave Unit 2025
- 691 Butler Ave
- 685 Butler Ave
- 2096 W Mound St
- 2102 W Mound St
- 2106 W Mound St
- 679 Butler Ave
- 704 Whitethorne Ave
- 698 Whitethorne Ave
- 692 Whitethorne Ave
- 2084 W Mound St
- 675 Butler Ave
- 692 Butler Ave
- 686 Butler Ave
- 684 Whitethorne Ave
- 682 Butler Ave
- 2078 W Mound St
- 667 Butler Ave
- 680 Whitethorne Ave
- 2072 W Mound St
- 670 Butler Ave
Your Personal Tour Guide
Ask me questions while you tour the home.