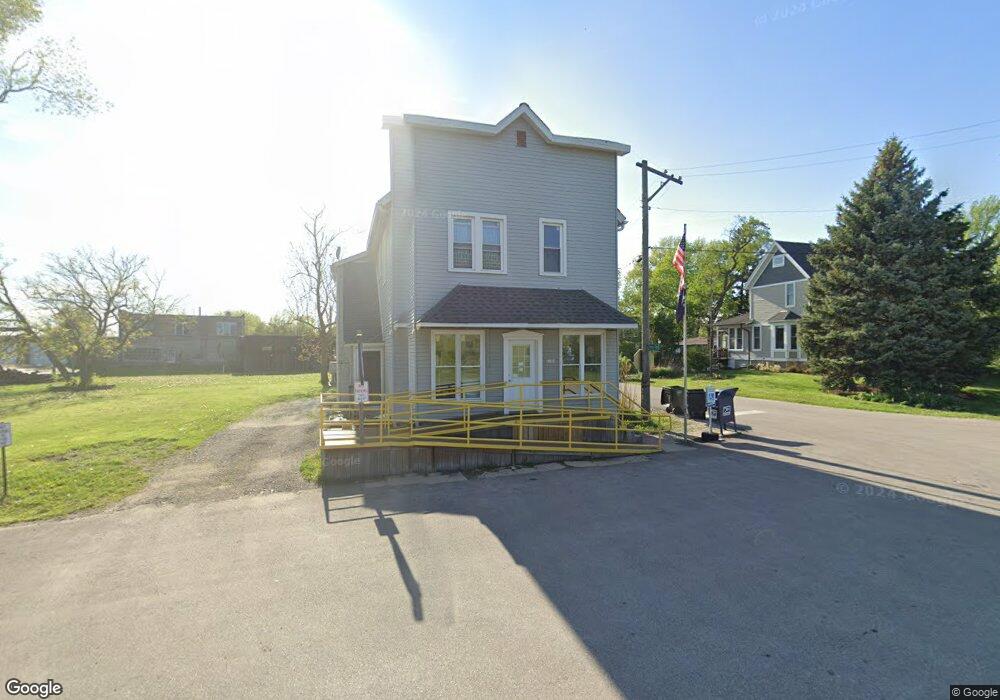
6S404 Eola Rd Eola, IL 60519
Eola Yards NeighborhoodEstimated Value: $282,735
2
Beds
1
Bath
1,950
Sq Ft
$145/Sq Ft
Est. Value
About This Home
This home is located at 6S404 Eola Rd, Eola, IL 60519 and is currently estimated at $282,735, approximately $144 per square foot. 6S404 Eola Rd is a home located in DuPage County with nearby schools including Gwendolyn Brooks Elementary School, Francis Granger Middle School, and Metea Valley High School.
Ownership History
Date
Name
Owned For
Owner Type
Purchase Details
Closed on
Sep 8, 2016
Sold by
Fh Corporation
Bought by
Raddar Ii Llc Series 1
Current Estimated Value
Purchase Details
Closed on
Oct 6, 2014
Sold by
Scherston Real Estate Investments Llc
Bought by
Fh Corporation
Purchase Details
Closed on
Feb 27, 2013
Sold by
Eola Properties Llc
Bought by
Scherston Real Estate Investments Llc
Purchase Details
Closed on
Jun 26, 2007
Sold by
Carpenter Darrell and Carpenter Jan
Bought by
Eola Property Llc
Home Financials for this Owner
Home Financials are based on the most recent Mortgage that was taken out on this home.
Original Mortgage
$165,000
Interest Rate
8.5%
Mortgage Type
Purchase Money Mortgage
Purchase Details
Closed on
May 13, 2005
Sold by
Harris Trust & Savings Bank
Bought by
Carpenter Darrell and Carpenter Jan
Create a Home Valuation Report for This Property
The Home Valuation Report is an in-depth analysis detailing your home's value as well as a comparison with similar homes in the area
Home Values in the Area
Average Home Value in this Area
Purchase History
| Date | Buyer | Sale Price | Title Company |
|---|---|---|---|
| Raddar Ii Llc Series 1 | $175,000 | First American Title Company | |
| Fh Corporation | $84,500 | Ctic | |
| Scherston Real Estate Investments Llc | -- | None Available | |
| Eola Property Llc | $230,000 | None Available | |
| Carpenter Darrell | $75,000 | -- |
Source: Public Records
Mortgage History
| Date | Status | Borrower | Loan Amount |
|---|---|---|---|
| Previous Owner | Eola Property Llc | $165,000 |
Source: Public Records
Tax History
| Year | Tax Paid | Tax Assessment Tax Assessment Total Assessment is a certain percentage of the fair market value that is determined by local assessors to be the total taxable value of land and additions on the property. | Land | Improvement |
|---|---|---|---|---|
| 2024 | $3,760 | $66,395 | $17,539 | $48,856 |
| 2023 | $3,621 | $59,660 | $15,760 | $43,900 |
| 2022 | $3,293 | $53,100 | $16,900 | $36,200 |
| 2021 | $3,182 | $51,210 | $16,300 | $34,910 |
| 2020 | $3,178 | $51,210 | $16,300 | $34,910 |
| 2019 | $3,060 | $48,700 | $15,500 | $33,200 |
| 2018 | $2,996 | $46,670 | $14,850 | $31,820 |
| 2017 | $2,925 | $45,090 | $14,350 | $30,740 |
| 2016 | $2,866 | $43,270 | $13,770 | $29,500 |
| 2015 | $2,855 | $41,080 | $13,070 | $28,010 |
| 2014 | $2,995 | $41,860 | $13,320 | $28,540 |
| 2013 | $2,994 | $42,150 | $13,410 | $28,740 |
Source: Public Records
Map
Nearby Homes
- 322 4th St
- 1110 Oakhill Dr
- 929 Preserve Ct Unit 2005
- 1015 Woodview Ct
- 1223 Townes Cir Unit 48
- 1037 Parkhill Cir
- 3161 Hopewell Dr
- 970 Waterside Ct
- 1283 Cranbrook Cir Unit 38
- 1740 Stable Ln
- 2700 Harlstone Dr Unit 53
- 530 Conservatory Ln
- 2314 Reflections Dr Unit C0602
- 2428 Ridgewood Ct
- 1600 Harris Dr
- 503 Metropolitan St Unit 503
- 530 Wolverine Dr
- 467 Vaughn Cir
- 369 Vaughn Cir
- 2752 Preserve Cir Unit 13006
Your Personal Tour Guide
Ask me questions while you tour the home.