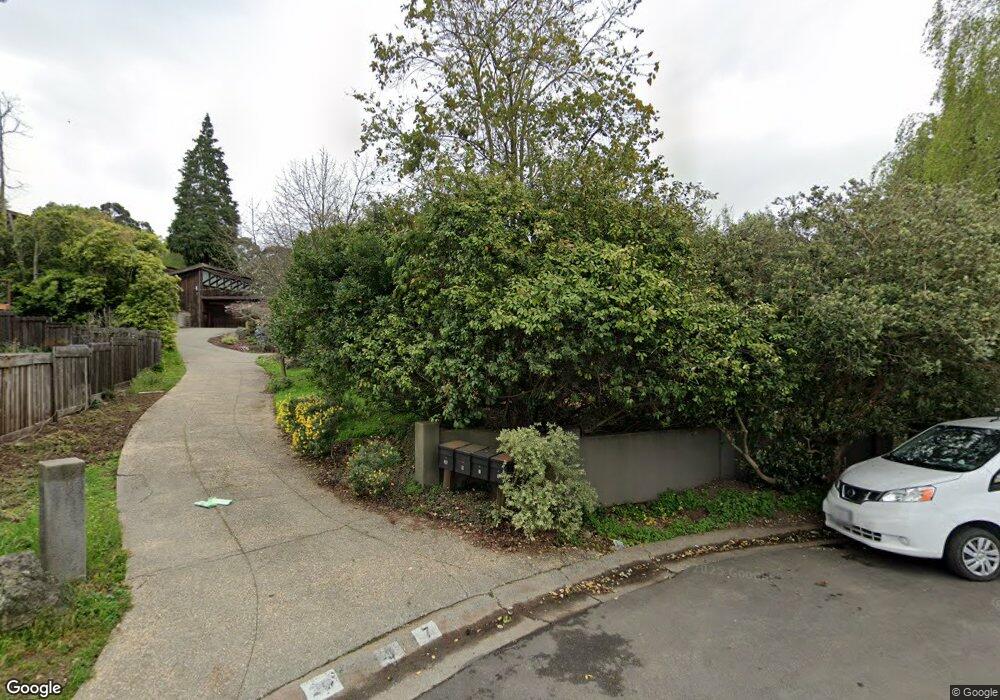
7 Ajax Place Berkeley, CA 94708
Berkeley Hills NeighborhoodEstimated Value: $1,767,000 - $3,830,000
3
Beds
3
Baths
2,474
Sq Ft
$987/Sq Ft
Est. Value
About This Home
This home is located at 7 Ajax Place, Berkeley, CA 94708 and is currently estimated at $2,441,211, approximately $986 per square foot. 7 Ajax Place is a home located in Alameda County with nearby schools including Cragmont Elementary School, Berkeley Arts Magnet at Whittier School, and Washington Elementary School.
Ownership History
Date
Name
Owned For
Owner Type
Purchase Details
Closed on
May 22, 2012
Sold by
Bloom James E and Bloom Melissa D
Bought by
Weinstein Karen and Karen Weinstein Living Trust
Current Estimated Value
Purchase Details
Closed on
Feb 15, 1996
Sold by
Stokes Eugene H and Stokes Norma M
Bought by
Bloom James E and Bloom Melissa D
Home Financials for this Owner
Home Financials are based on the most recent Mortgage that was taken out on this home.
Original Mortgage
$425,000
Interest Rate
7.04%
Purchase Details
Closed on
Jul 28, 1994
Sold by
Stokes Eugene H and Stokes Norma M
Bought by
Stokes Eugene H and Stokes Norma M
Create a Home Valuation Report for This Property
The Home Valuation Report is an in-depth analysis detailing your home's value as well as a comparison with similar homes in the area
Home Values in the Area
Average Home Value in this Area
Purchase History
| Date | Buyer | Sale Price | Title Company |
|---|---|---|---|
| Weinstein Karen | $1,390,000 | Chicago Title Company | |
| Bloom James E | $572,500 | First American Title Guarant | |
| Stokes Eugene H | -- | -- |
Source: Public Records
Mortgage History
| Date | Status | Borrower | Loan Amount |
|---|---|---|---|
| Previous Owner | Bloom James E | $425,000 |
Source: Public Records
Tax History
| Year | Tax Paid | Tax Assessment Tax Assessment Total Assessment is a certain percentage of the fair market value that is determined by local assessors to be the total taxable value of land and additions on the property. | Land | Improvement |
|---|---|---|---|---|
| 2025 | $24,466 | $1,738,825 | $523,747 | $1,222,078 |
| 2024 | $24,466 | $1,704,604 | $513,481 | $1,198,123 |
| 2023 | $23,966 | $1,678,048 | $503,414 | $1,174,634 |
| 2022 | $23,578 | $1,638,147 | $493,544 | $1,151,603 |
| 2021 | $23,664 | $1,605,900 | $483,870 | $1,129,030 |
| 2020 | $22,540 | $1,596,372 | $478,911 | $1,117,461 |
| 2019 | $21,812 | $1,565,084 | $469,525 | $1,095,559 |
| 2018 | $21,470 | $1,534,406 | $460,322 | $1,074,084 |
| 2017 | $20,745 | $1,504,327 | $451,298 | $1,053,029 |
| 2016 | $20,190 | $1,474,831 | $442,449 | $1,032,382 |
| 2015 | $19,931 | $1,452,688 | $435,806 | $1,016,882 |
| 2014 | $19,605 | $1,424,234 | $427,270 | $996,964 |
Source: Public Records
Map
Nearby Homes
- 1221 Grizzly Peak Blvd
- 1375 Queens Rd
- 2924 Shasta Rd
- 230 Fairlawn Dr
- 1160 Miller Ave
- 1123 Park Hills Rd
- 20 Stevenson Ave
- 1155 Keeler Ave
- 1110 Sterling Ave
- 1179 Keith Ave
- 1119 Miller Ave
- 1165 Cragmont Ave
- 2686 Shasta Rd
- 1100 Miller Ave
- 2893 Buena Vista Way
- 1040 Park Hills Rd
- 1106 Cragmont Ave
- 1024 Grizzly Peak Blvd
- 2501 Rose Walk
- 1024 Miller Ave
Your Personal Tour Guide
Ask me questions while you tour the home.