
Landlord's Agent in 2019
Anuradha Rao
RE/MAX
(603) 566-9600
49 in this area
166 Total Sales
Estimated Value: $779,514 - $825,000
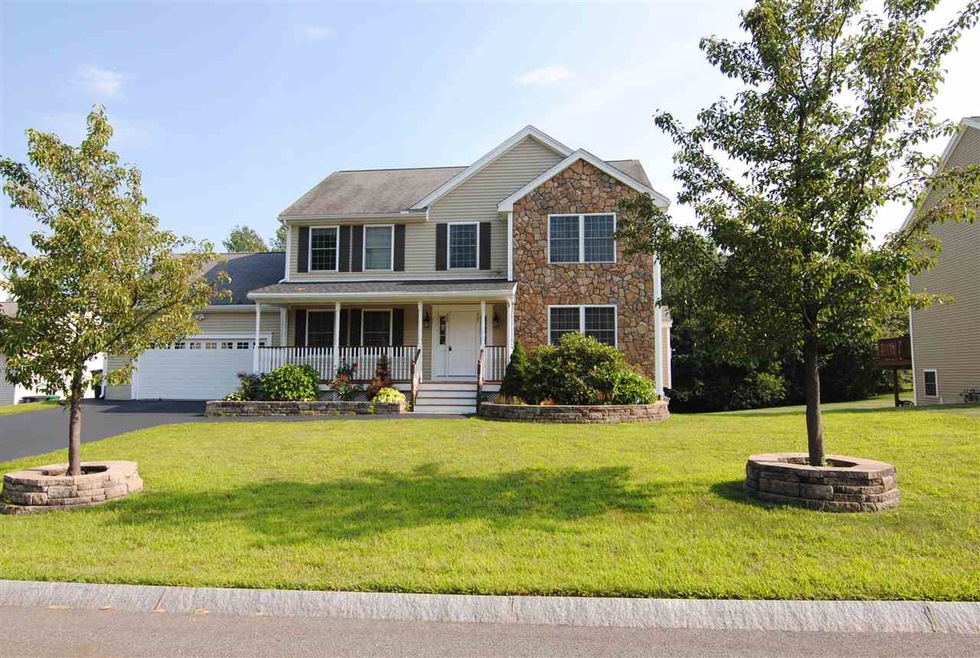
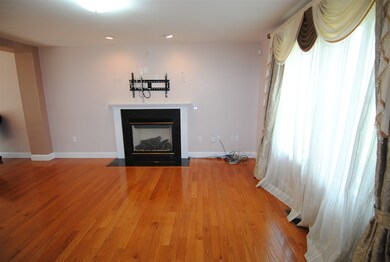
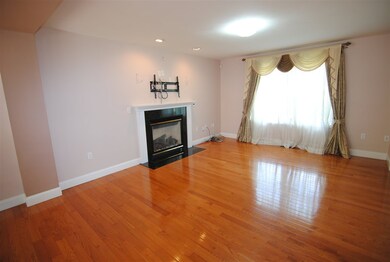
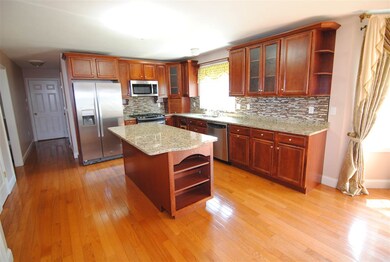
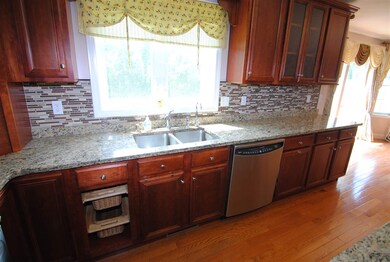
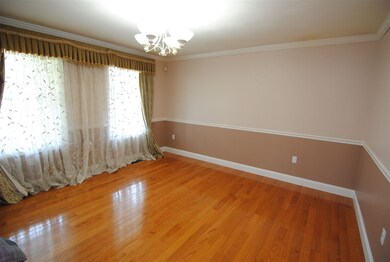
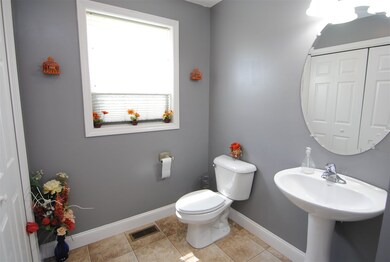
Available immediately is this beautiful 4 bedroom colonial in sought out after and desirable Rosewood at Gagnon farms in South Nashua. The first floor with beautiful hardwood offers a nice floor plan which has the family room with gas fireplace, update kitchen with pantry cabinets, island, granite counter and stainless steel appliances. Nice large dining room with hardwood & 1/2 bathroom with laundry. 2nd floor offers 4 bdrm and 2 bathrooms. The master bdrm with cathedral ceiling is large and bright with huge walk in closet and luxury bathroom. The walk out lower level is full & unfinished for all your storage requirements. The house offers a lovely backyard for you to enjoy. Come on over and see for yourself. Credit, background, eviction & income check. No pets please!
Last Agent to Rent the Property
RE/MAX Innovative Properties License #064273 Listed on: 07/30/2019
| Date | Buyer | Sale Price | Title Company |
|---|---|---|---|
| Chall Daljit Singh | $442,000 | -- |
| Date | Status | Borrower | Loan Amount |
|---|---|---|---|
| Open | Chall Daljit Singh | $375,250 | |
| Closed | Chall Daljit Singh | $398,760 | |
| Closed | Chall Daljit Singh | $397,800 |
| Date | Event | Price | List to Sale | Price per Sq Ft |
|---|---|---|---|---|
| 08/13/2019 08/13/19 | Rented | $2,950 | 0.0% | -- |
| 07/30/2019 07/30/19 | For Rent | $2,950 | -- | -- |
| Year | Tax Paid | Tax Assessment Tax Assessment Total Assessment is a certain percentage of the fair market value that is determined by local assessors to be the total taxable value of land and additions on the property. | Land | Improvement |
|---|---|---|---|---|
| 2024 | $11,847 | $745,100 | $179,900 | $565,200 |
| 2023 | $11,266 | $618,000 | $143,900 | $474,100 |
| 2022 | $11,167 | $618,000 | $143,900 | $474,100 |
| 2021 | $10,268 | $442,200 | $134,300 | $307,900 |
| 2020 | $9,998 | $442,200 | $134,300 | $307,900 |
| 2019 | $9,622 | $442,200 | $134,300 | $307,900 |
| 2018 | $9,379 | $442,200 | $134,300 | $307,900 |
| 2017 | $9,607 | $372,500 | $112,700 | $259,800 |
| 2016 | $9,339 | $372,500 | $112,700 | $259,800 |
| 2015 | $9,137 | $372,500 | $112,700 | $259,800 |
| 2014 | $8,959 | $372,500 | $112,700 | $259,800 |
Landlord's Agent in 2019
Anuradha Rao
RE/MAX
(603) 566-9600
49 in this area
166 Total Sales
Tenant's Agent in 2019
Barry Warhola
Monument Realty
(603) 759-3849
26 in this area
167 Total Sales
Source: PrimeMLS
MLS Number: 4767896
APN: NASH-000000-000000-002906C
Disclaimer: Certain information contained herein is derived from information provided by parties other than Homes.com. All information provided is deemed reliable, but is not guaranteed to be accurate and should be independently verified.
![]() Copyright 2025 PrimeMLS, Inc. All rights reserved. This information is deemed reliable, but not guaranteed. The data relating to real estate displayed on this display comes in part from the IDX Program of PrimeMLS. The information being provided is for consumers’ personal, non-commercial use and may not be used for any purpose other than to identify prospective properties consumers may be interested in purchasing.
Copyright 2025 PrimeMLS, Inc. All rights reserved. This information is deemed reliable, but not guaranteed. The data relating to real estate displayed on this display comes in part from the IDX Program of PrimeMLS. The information being provided is for consumers’ personal, non-commercial use and may not be used for any purpose other than to identify prospective properties consumers may be interested in purchasing.