
Seller's Agent in 2025
Madiha Farag
BHG Masiello Durham
(571) 239-1383
64 in this area
117 Total Sales
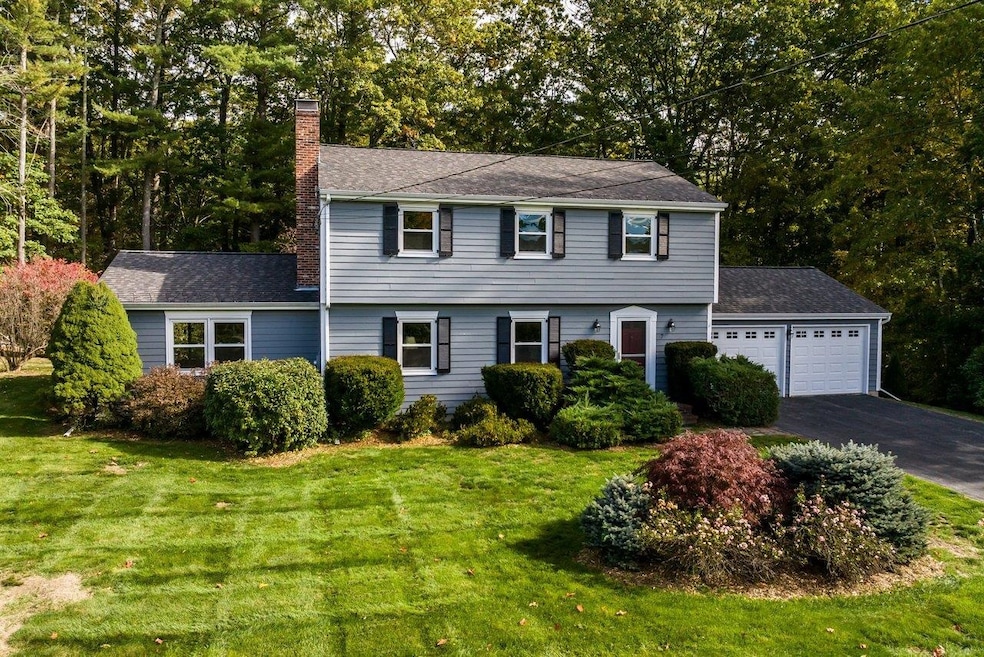
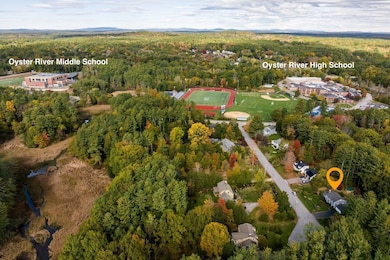
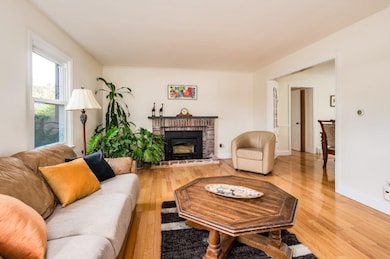
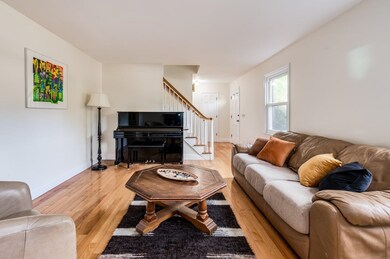
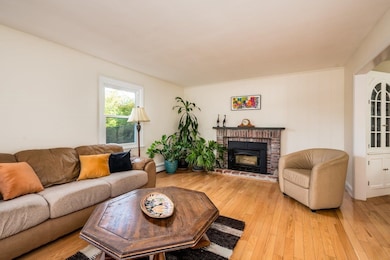
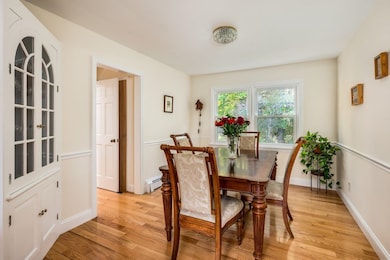
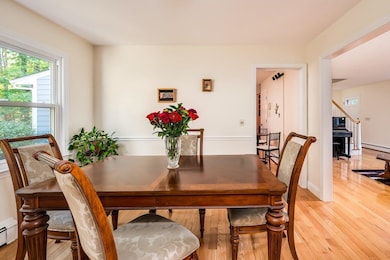
Location, location, location! Step into this inviting 5-bedroom Colonial and instantly feel at home. The formal living room with its cozy fireplace sets the stage for both relaxing and entertaining. The updated kitchen offers generous workspace, while the family room—featuring a charming brick fireplace and slider to the deck—creates the perfect spot for movie nights or game time. A dining room with a built-in corner hutch adds character and warmth. The first-floor primary suite provides comfort and convenience, while four additional bedrooms and a full updated bath upstairs offer plenty of space for family or guests, hardwood floors throughout. Situated on a beautifully landscaped 0.84-acre lot, this home is ideal for outdoor fun, from yard games to summer BBQs on the patio. Enjoy peaceful moments in your private back yard and appreciate being close to schools, downtown, UNH, public library and major commuting routes. Showings begin at open house on Thursday October 10/23/25 4pm to 6pm
Last Agent to Sell the Property
BHG Masiello Durham License #010076 Listed on: 10/21/2025
| Date | Type | Sale Price | Title Company |
|---|---|---|---|
| Warranty Deed | $717,533 | -- | |
| Warranty Deed | $717,533 | -- | |
| Warranty Deed | -- | -- | |
| Warranty Deed | -- | -- | |
| Warranty Deed | -- | -- | |
| Warranty Deed | -- | -- | |
| Deed | $373,000 | -- | |
| Deed | $373,000 | -- |
| Date | Status | Loan Amount | Loan Type |
|---|---|---|---|
| Open | $538,125 | New Conventional | |
| Closed | $538,125 | New Conventional | |
| Previous Owner | $298,400 | Purchase Money Mortgage |
| Date | Event | Price | List to Sale | Price per Sq Ft |
|---|---|---|---|---|
| 12/22/2025 12/22/25 | Sold | $717,500 | -2.4% | $302 / Sq Ft |
| 10/21/2025 10/21/25 | For Sale | $735,000 | -- | $310 / Sq Ft |
| Year | Tax Paid | Tax Assessment Tax Assessment Total Assessment is a certain percentage of the fair market value that is determined by local assessors to be the total taxable value of land and additions on the property. | Land | Improvement |
|---|---|---|---|---|
| 2024 | $10,757 | $529,100 | $203,400 | $325,700 |
| 2023 | $10,836 | $529,100 | $203,400 | $325,700 |
| 2022 | $10,974 | $377,900 | $135,600 | $242,300 |
| 2021 | $10,544 | $377,800 | $135,500 | $242,300 |
| 2020 | $10,476 | $377,800 | $135,500 | $242,300 |
| 2019 | $10,363 | $377,800 | $135,500 | $242,300 |
| 2018 | $10,125 | $377,800 | $135,500 | $242,300 |
| 2017 | $9,955 | $324,900 | $104,200 | $220,700 |
| 2016 | $9,659 | $324,900 | $104,200 | $220,700 |
| 2015 | $9,698 | $324,900 | $104,200 | $220,700 |
| 2014 | $9,916 | $324,900 | $104,200 | $220,700 |
| 2013 | $9,880 | $324,900 | $104,200 | $220,700 |
Seller's Agent in 2025
Madiha Farag
BHG Masiello Durham
(571) 239-1383
64 in this area
117 Total Sales
Buyer's Agent in 2025
Jon McCormack
Duston Leddy Real Estate
(603) 661-7830
3 in this area
101 Total Sales
Source: PrimeMLS
MLS Number: 5066616
APN: DRHM-000004-000045-000009
Disclaimer: Certain information contained herein is derived from information provided by parties other than Homes.com. All information provided is deemed reliable, but is not guaranteed to be accurate and should be independently verified.
![]() Copyright 2026 PrimeMLS, Inc. All rights reserved. This information is deemed reliable, but not guaranteed. The data relating to real estate displayed on this display comes in part from the IDX Program of PrimeMLS. The information being provided is for consumers’ personal, non-commercial use and may not be used for any purpose other than to identify prospective properties consumers may be interested in purchasing.
Copyright 2026 PrimeMLS, Inc. All rights reserved. This information is deemed reliable, but not guaranteed. The data relating to real estate displayed on this display comes in part from the IDX Program of PrimeMLS. The information being provided is for consumers’ personal, non-commercial use and may not be used for any purpose other than to identify prospective properties consumers may be interested in purchasing.
Ask me questions while you tour the home.