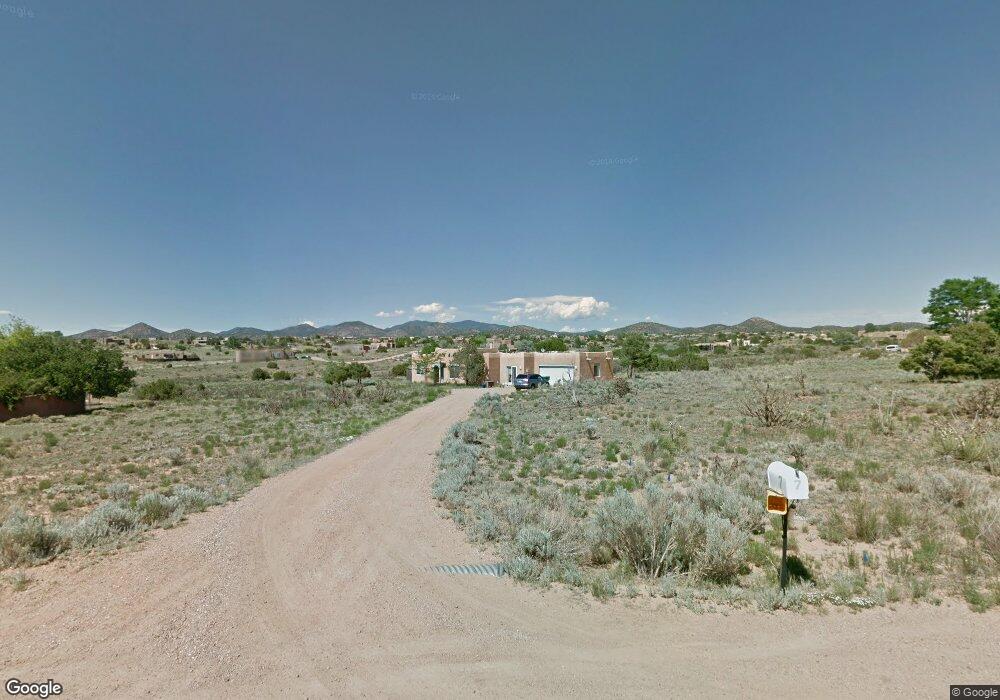
7 Bosque Loop Santa Fe, NM 87508
Eldorado at Santa Fe NeighborhoodEstimated Value: $568,741 - $739,000
3
Beds
1
Bath
1,626
Sq Ft
$390/Sq Ft
Est. Value
About This Home
This home is located at 7 Bosque Loop, Santa Fe, NM 87508 and is currently estimated at $634,435, approximately $390 per square foot. 7 Bosque Loop is a home located in Santa Fe County with nearby schools including El Dorado Community School and Santa Fe High School.
Ownership History
Date
Name
Owned For
Owner Type
Purchase Details
Closed on
Mar 29, 2013
Sold by
Nelson Jan Thomas and Nelson Elaine S
Bought by
Nelson Jan Thomas and Nelson Elaine Stewart
Current Estimated Value
Purchase Details
Closed on
Jul 26, 2001
Sold by
Khalsa Sat Nam Singh and Khalsa G
Bought by
Nelson Jan T and Nelson Elaine S
Home Financials for this Owner
Home Financials are based on the most recent Mortgage that was taken out on this home.
Original Mortgage
$243,227
Interest Rate
7.07%
Mortgage Type
Seller Take Back
Create a Home Valuation Report for This Property
The Home Valuation Report is an in-depth analysis detailing your home's value as well as a comparison with similar homes in the area
Home Values in the Area
Average Home Value in this Area
Purchase History
| Date | Buyer | Sale Price | Title Company |
|---|---|---|---|
| Nelson Jan Thomas | -- | None Available | |
| Nelson Jan T | $286,150 | -- |
Source: Public Records
Mortgage History
| Date | Status | Borrower | Loan Amount |
|---|---|---|---|
| Previous Owner | Nelson Jan T | $243,227 |
Source: Public Records
Tax History
| Year | Tax Paid | Tax Assessment Tax Assessment Total Assessment is a certain percentage of the fair market value that is determined by local assessors to be the total taxable value of land and additions on the property. | Land | Improvement |
|---|---|---|---|---|
| 2025 | $2,524 | $302,656 | $79,755 | $222,901 |
| 2024 | $2,474 | $293,842 | $77,433 | $216,409 |
| 2023 | $2,476 | $285,284 | $75,178 | $210,106 |
| 2022 | $2,333 | $276,976 | $72,989 | $203,987 |
| 2021 | $2,304 | $89,637 | $23,621 | $66,016 |
| 2020 | $2,263 | $87,026 | $22,933 | $64,093 |
| 2019 | $2,214 | $84,491 | $22,933 | $61,558 |
| 2018 | $2,165 | $82,031 | $22,933 | $59,098 |
| 2017 | $2,106 | $79,642 | $22,933 | $56,709 |
| 2016 | $1,857 | $72,660 | $29,534 | $43,126 |
| 2015 | $1,834 | $70,544 | $28,674 | $41,870 |
| 2014 | $1,665 | $68,422 | $19,051 | $49,371 |
Source: Public Records
Map
Nearby Homes
- 7 Eldorado Way
- 73 Condesa Rd
- 0 Tren Viaduct
- 8 Carlito Rd
- 10 Carlito Rd
- 16 Cuesta Rd
- 4 Herrada Ct
- 39 Monterey Rd
- 13 Palacio
- 3 Solano Ct
- 68 Avenida Las Nubes
- 33 Moya Loop
- 24 Camino Caballos Spur
- 14 Vista Estrella N
- 72 Moya Rd
- 20 Avenida Del Monte Alto
- 6 Verano Loop
- 14 Vista Estrella S
- 15 N Hijo de Dios
- 238 Avenida de Compadres
Your Personal Tour Guide
Ask me questions while you tour the home.