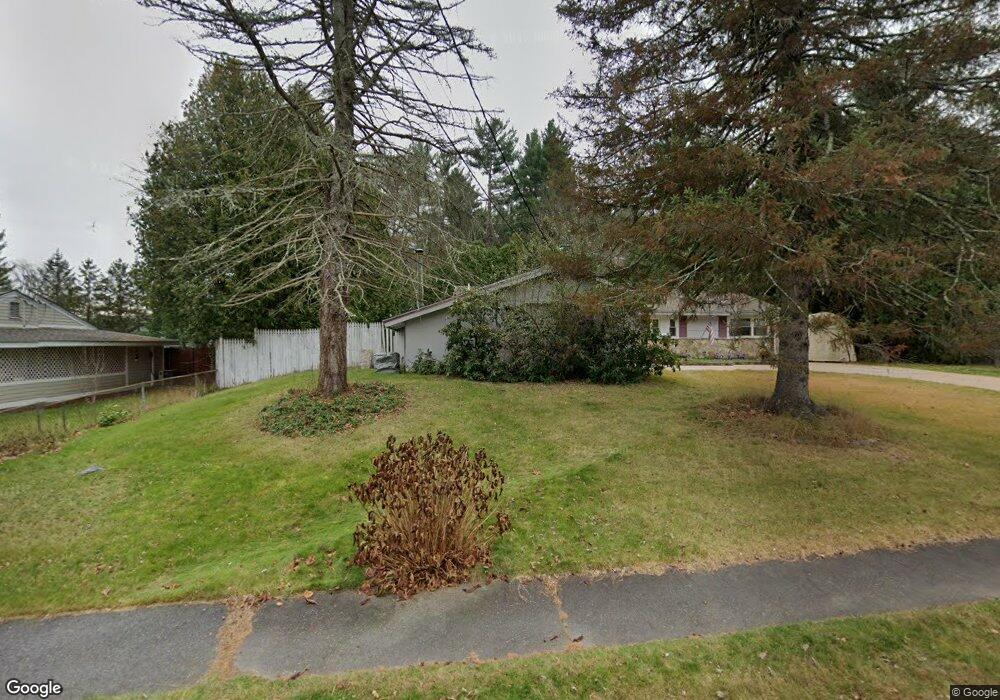
7 Bradford Rd Hudson, MA 01749
Estimated Value: $572,000 - $608,000
3
Beds
2
Baths
1,464
Sq Ft
$401/Sq Ft
Est. Value
About This Home
This home is located at 7 Bradford Rd, Hudson, MA 01749 and is currently estimated at $587,695, approximately $401 per square foot. 7 Bradford Rd is a home located in Middlesex County with nearby schools including David J. Quinn Middle School, Hudson High School, and First Steps Children's Center.
Ownership History
Date
Name
Owned For
Owner Type
Purchase Details
Closed on
Apr 13, 1995
Sold by
Cavaco Jose M and Cavaco Annmarie
Bought by
Chaves Rui J and Chaves Margarida M
Current Estimated Value
Home Financials for this Owner
Home Financials are based on the most recent Mortgage that was taken out on this home.
Original Mortgage
$118,201
Interest Rate
8.49%
Mortgage Type
Purchase Money Mortgage
Create a Home Valuation Report for This Property
The Home Valuation Report is an in-depth analysis detailing your home's value as well as a comparison with similar homes in the area
Home Values in the Area
Average Home Value in this Area
Purchase History
| Date | Buyer | Sale Price | Title Company |
|---|---|---|---|
| Chaves Rui J | $120,000 | -- |
Source: Public Records
Mortgage History
| Date | Status | Borrower | Loan Amount |
|---|---|---|---|
| Open | Chaves Rui J | $135,500 | |
| Closed | Chaves Rui J | $116,519 | |
| Closed | Chaves Rui J | $118,201 |
Source: Public Records
Tax History Compared to Growth
Tax History
| Year | Tax Paid | Tax Assessment Tax Assessment Total Assessment is a certain percentage of the fair market value that is determined by local assessors to be the total taxable value of land and additions on the property. | Land | Improvement |
|---|---|---|---|---|
| 2025 | $6,760 | $487,000 | $183,200 | $303,800 |
| 2024 | $6,338 | $452,700 | $166,500 | $286,200 |
| 2023 | $5,820 | $398,600 | $160,100 | $238,500 |
| 2022 | $5,614 | $354,000 | $145,500 | $208,500 |
| 2021 | $5,470 | $329,700 | $138,600 | $191,100 |
| 2020 | $5,395 | $324,800 | $135,900 | $188,900 |
| 2019 | $5,351 | $316,700 | $135,900 | $180,800 |
| 2018 | $5,217 | $298,100 | $129,500 | $168,600 |
| 2017 | $12,071 | $279,700 | $123,300 | $156,400 |
| 2016 | $4,556 | $263,500 | $123,300 | $140,200 |
| 2015 | $4,062 | $235,200 | $123,300 | $111,900 |
| 2014 | $3,998 | $229,500 | $108,000 | $121,500 |
Source: Public Records
Map
Nearby Homes
- 133 Lincoln St
- 1 Barracks Rd Unit 1
- 104 Lincoln St
- 200 Manning St Unit 6C
- 200 Manning St Unit 14B
- 74 Cox St Unit 9
- 55 Cottage St
- 346 Long Hill Rd
- 223 Central St
- 76 Woobly Rd
- 18-24 River St Unit 1
- 4 Linden St
- 30 Maple St
- 6 Century Mill Rd
- 1 Century Mill Rd
- 3 Highland Park Ave
- 65 Main St
- 21 Gates Ave
- 248 Main St Unit 207
- 248 Main St Unit 216