Estimated Value: $629,112 - $806,000
2
Beds
1
Bath
910
Sq Ft
$790/Sq Ft
Est. Value
About This Home
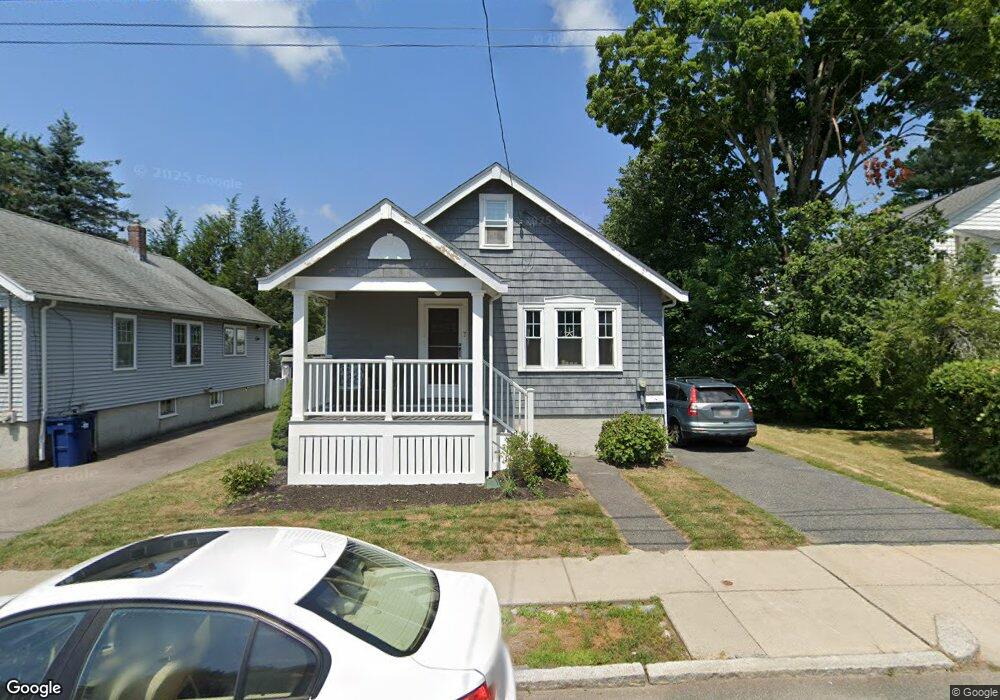
This home is located at 7 Brier Rd, West Roxbury, MA 02132 and is currently estimated at $718,778, approximately $789 per square foot. 7 Brier Rd is a home located in Suffolk County with nearby schools including St Theresa School, Holy Name Parish School, and The Roxbury Latin School.
Ownership History
Date
Name
Owned For
Owner Type
Purchase Details
Closed on
May 19, 2022
Sold by
Collins Catherine A
Bought by
Collins Grehan Ft
Current Estimated Value
Purchase Details
Closed on
Aug 12, 1999
Sold by
Mccabe Stephanie
Bought by
Collins Catherine A
Purchase Details
Closed on
Jun 21, 1996
Sold by
Bleckinger Dorothy L
Bought by
Mccabe Steven D and Mccabe Stephanie A
Purchase Details
Closed on
Mar 25, 1991
Sold by
Kerwin Julia F
Bought by
Bleckinger Dorothy L
Create a Home Valuation Report for This Property
The Home Valuation Report is an in-depth analysis detailing your home's value as well as a comparison with similar homes in the area
Home Values in the Area
Average Home Value in this Area
Purchase History
| Date | Buyer | Sale Price | Title Company |
|---|---|---|---|
| Collins Grehan Ft | -- | None Available | |
| Collins Catherine A | $225,000 | -- | |
| Mccabe Steven D | $143,000 | -- | |
| Bleckinger Dorothy L | $129,000 | -- |
Source: Public Records
Mortgage History
| Date | Status | Borrower | Loan Amount |
|---|---|---|---|
| Previous Owner | Bleckinger Dorothy L | $120,000 | |
| Previous Owner | Bleckinger Dorothy L | $165,400 | |
| Previous Owner | Bleckinger Dorothy L | $167,200 |
Source: Public Records
Tax History Compared to Growth
Tax History
| Year | Tax Paid | Tax Assessment Tax Assessment Total Assessment is a certain percentage of the fair market value that is determined by local assessors to be the total taxable value of land and additions on the property. | Land | Improvement |
|---|---|---|---|---|
| 2025 | $6,411 | $553,600 | $196,700 | $356,900 |
| 2024 | $6,051 | $555,100 | $217,500 | $337,600 |
| 2023 | $5,625 | $523,700 | $205,200 | $318,500 |
| 2022 | $5,180 | $476,100 | $186,500 | $289,600 |
| 2021 | $4,815 | $451,300 | $181,100 | $270,200 |
| 2020 | $4,142 | $392,200 | $164,800 | $227,400 |
| 2019 | $3,842 | $364,500 | $142,500 | $222,000 |
| 2018 | $3,637 | $347,000 | $142,500 | $204,500 |
| 2017 | $3,638 | $343,500 | $142,500 | $201,000 |
| 2016 | $3,564 | $324,000 | $142,500 | $181,500 |
| 2015 | $3,761 | $310,600 | $145,900 | $164,700 |
| 2014 | $3,648 | $290,000 | $145,900 | $144,100 |
Source: Public Records
Map
Nearby Homes
- 145 Lagrange St
- 275 Bellevue St
- 12 Loyola Cir
- 73 Woodard Rd
- 12 Eagle St
- 348 Lagrange St
- 54 Sturges Rd
- 50 Heron St
- 35 Heron St
- 14 Starling St
- 4873 Washington St Unit 1
- 2 Lagrange St Unit 4
- 152 Stratford St
- 10 Starling St
- 2231 Centre St
- 425 Lagrange St Unit 203
- 4959 Washington St
- 27-29 Temple St
- 4975 Washington St Unit 306
- 4975 Washington St Unit 311