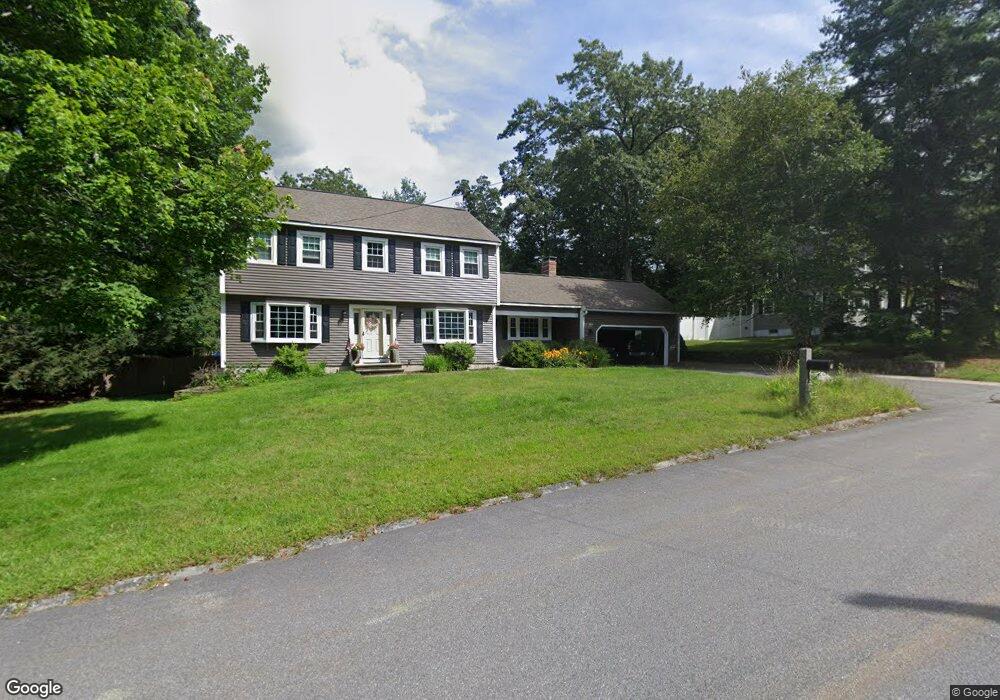
7 Byron Dr Nashua, NH 03062
Southwest Nashua NeighborhoodEstimated Value: $688,000 - $778,000
3
Beds
3
Baths
2,328
Sq Ft
$312/Sq Ft
Est. Value
About This Home
This home is located at 7 Byron Dr, Nashua, NH 03062 and is currently estimated at $726,441, approximately $312 per square foot. 7 Byron Dr is a home located in Hillsborough County with nearby schools including Bicentennial Elementary School, Fairgrounds Middle School, and Nashua High School South.
Ownership History
Date
Name
Owned For
Owner Type
Purchase Details
Closed on
Aug 27, 2008
Sold by
Giles Thomas M and Giles Lauren M
Bought by
Sullivan Kevin T and Sullivan Mary F
Current Estimated Value
Home Financials for this Owner
Home Financials are based on the most recent Mortgage that was taken out on this home.
Original Mortgage
$265,000
Interest Rate
6.29%
Mortgage Type
Purchase Money Mortgage
Purchase Details
Closed on
Jul 18, 2005
Sold by
Lin Chih Ching and Lin Shaun W
Bought by
Giles Thomas M and Giles Lauren M
Create a Home Valuation Report for This Property
The Home Valuation Report is an in-depth analysis detailing your home's value as well as a comparison with similar homes in the area
Home Values in the Area
Average Home Value in this Area
Purchase History
| Date | Buyer | Sale Price | Title Company |
|---|---|---|---|
| Sullivan Kevin T | $375,000 | -- | |
| Giles Thomas M | $378,000 | -- |
Source: Public Records
Mortgage History
| Date | Status | Borrower | Loan Amount |
|---|---|---|---|
| Open | Giles Thomas M | $272,000 | |
| Closed | Giles Thomas M | $279,000 | |
| Closed | Giles Thomas M | $265,000 |
Source: Public Records
Tax History Compared to Growth
Tax History
| Year | Tax Paid | Tax Assessment Tax Assessment Total Assessment is a certain percentage of the fair market value that is determined by local assessors to be the total taxable value of land and additions on the property. | Land | Improvement |
|---|---|---|---|---|
| 2024 | $9,669 | $608,100 | $180,900 | $427,200 |
| 2023 | $9,241 | $506,900 | $144,700 | $362,200 |
| 2022 | $9,160 | $506,900 | $144,700 | $362,200 |
| 2021 | $8,670 | $373,400 | $106,100 | $267,300 |
| 2020 | $8,257 | $365,200 | $106,100 | $259,100 |
| 2019 | $7,947 | $365,200 | $106,100 | $259,100 |
| 2018 | $7,746 | $365,200 | $106,100 | $259,100 |
| 2017 | $7,985 | $309,600 | $91,700 | $217,900 |
| 2016 | $7,762 | $309,600 | $91,700 | $217,900 |
| 2015 | $7,594 | $309,600 | $91,700 | $217,900 |
| 2014 | $7,446 | $309,600 | $91,700 | $217,900 |
Source: Public Records
Map
Nearby Homes
- 9 Byron Dr
- 61 Spindlewick Dr
- 125 Lille Rd
- 29 Dickens St
- 17 Herrick St
- 59 Pike St
- 5 Appaloosa Place
- 15 Learned St Unit 123
- 36 Eastman St Unit 26
- 6 Hayden St
- 57 Wethersfield Rd
- 33 Cannon Dr
- 7 Fairhaven Rd
- 29 Greenwood Dr
- 73 Bluestone Dr
- 85 Bluestone Dr
- 285 E Dunstable Rd
- 160 Daniel Webster Hwy Unit 328
- 92 Bluestone Dr
- 63 Dexter St