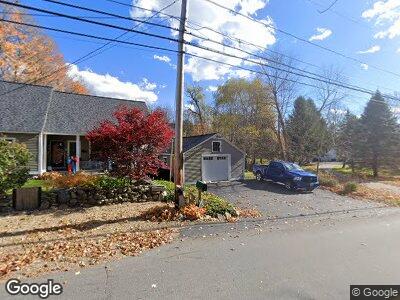
7 Chase Rd South Hampton, NH 03827
Estimated Value: $763,000 - $1,713,000
5
Beds
4
Baths
4,737
Sq Ft
$217/Sq Ft
Est. Value
About This Home
This home is located at 7 Chase Rd, South Hampton, NH 03827 and is currently estimated at $1,025,798, approximately $216 per square foot. 7 Chase Rd is a home located in Rockingham County with nearby schools including South Hampton Barnard School, Winnacunnet High School, and Amesbury Seventh-Day Adventist School.
Ownership History
Date
Name
Owned For
Owner Type
Purchase Details
Closed on
Aug 11, 2023
Sold by
Bucknell Peter S and Metcalf Christine
Bought by
Metcalf Nicholas and Metcalf Christine
Current Estimated Value
Purchase Details
Closed on
Sep 16, 2016
Sold by
Bucknell Peter S
Bought by
Bucknell Peter S and Metcalf Christine
Home Financials for this Owner
Home Financials are based on the most recent Mortgage that was taken out on this home.
Original Mortgage
$264,850
Interest Rate
3.43%
Mortgage Type
Stand Alone Refi Refinance Of Original Loan
Create a Home Valuation Report for This Property
The Home Valuation Report is an in-depth analysis detailing your home's value as well as a comparison with similar homes in the area
Home Values in the Area
Average Home Value in this Area
Purchase History
| Date | Buyer | Sale Price | Title Company |
|---|---|---|---|
| Metcalf Nicholas | -- | None Available | |
| Bucknell Peter S | -- | -- |
Source: Public Records
Mortgage History
| Date | Status | Borrower | Loan Amount |
|---|---|---|---|
| Previous Owner | Bucknell Peter S | $264,850 |
Source: Public Records
Tax History Compared to Growth
Tax History
| Year | Tax Paid | Tax Assessment Tax Assessment Total Assessment is a certain percentage of the fair market value that is determined by local assessors to be the total taxable value of land and additions on the property. | Land | Improvement |
|---|---|---|---|---|
| 2024 | $10,390 | $752,900 | $300,300 | $452,600 |
| 2023 | $10,390 | $752,900 | $300,300 | $452,600 |
| 2022 | $9,306 | $468,600 | $164,900 | $303,700 |
| 2021 | $9,220 | $462,600 | $164,900 | $297,700 |
| 2020 | $5,426 | $462,600 | $164,900 | $297,700 |
| 2019 | $7,857 | $462,600 | $164,900 | $297,700 |
| 2018 | $7,712 | $462,600 | $164,900 | $297,700 |
| 2017 | $7,152 | $371,700 | $143,600 | $228,100 |
| 2016 | $6,776 | $371,700 | $143,600 | $228,100 |
| 2015 | $7,408 | $371,700 | $143,600 | $228,100 |
| 2014 | $6,951 | $371,700 | $143,600 | $228,100 |
| 2012 | $7,536 | $510,900 | $194,000 | $316,900 |
Source: Public Records
Map
Nearby Homes