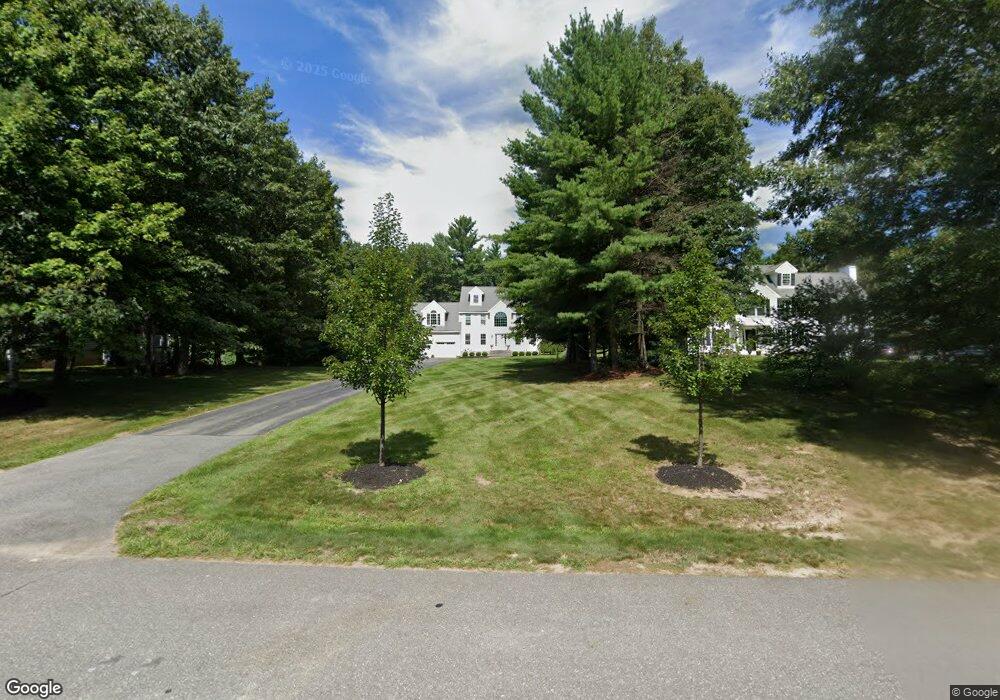
7 Corliss Rd Windham, NH 03087
Estimated Value: $960,415 - $1,168,000
4
Beds
3
Baths
3,305
Sq Ft
$319/Sq Ft
Est. Value
About This Home
This home is located at 7 Corliss Rd, Windham, NH 03087 and is currently estimated at $1,054,854, approximately $319 per square foot. 7 Corliss Rd is a home located in Rockingham County with nearby schools including Golden Brook Elementary School, Windham Middle School, and Windham High School.
Ownership History
Date
Name
Owned For
Owner Type
Purchase Details
Closed on
Dec 11, 2012
Sold by
Sprankling Dean and Sprankling Allison
Bought by
Marinaro Joseph C and Marinaro Anne E
Current Estimated Value
Purchase Details
Closed on
Oct 17, 2001
Sold by
Hills-Mor Const Co Inc
Bought by
Sprankling Dean and Sprankling Allison
Home Financials for this Owner
Home Financials are based on the most recent Mortgage that was taken out on this home.
Original Mortgage
$244,900
Interest Rate
6.92%
Create a Home Valuation Report for This Property
The Home Valuation Report is an in-depth analysis detailing your home's value as well as a comparison with similar homes in the area
Home Values in the Area
Average Home Value in this Area
Purchase History
| Date | Buyer | Sale Price | Title Company |
|---|---|---|---|
| Marinaro Joseph C | $413,000 | -- | |
| Marinaro Joseph C | $413,000 | -- | |
| Sprankling Dean | $367,900 | -- | |
| Sprankling Dean | $367,900 | -- |
Source: Public Records
Mortgage History
| Date | Status | Borrower | Loan Amount |
|---|---|---|---|
| Previous Owner | Sprankling Dean | $161,000 | |
| Previous Owner | Sprankling Dean | $244,900 | |
| Closed | Sprankling Dean | $0 |
Source: Public Records
Tax History Compared to Growth
Tax History
| Year | Tax Paid | Tax Assessment Tax Assessment Total Assessment is a certain percentage of the fair market value that is determined by local assessors to be the total taxable value of land and additions on the property. | Land | Improvement |
|---|---|---|---|---|
| 2024 | $12,513 | $552,700 | $185,800 | $366,900 |
| 2023 | $11,828 | $552,700 | $185,800 | $366,900 |
| 2022 | $10,921 | $552,700 | $185,800 | $366,900 |
| 2021 | $10,407 | $558,900 | $185,800 | $373,100 |
| 2020 | $10,692 | $558,900 | $185,800 | $373,100 |
| 2019 | $9,403 | $417,000 | $156,900 | $260,100 |
| 2018 | $9,712 | $417,000 | $156,900 | $260,100 |
| 2017 | $8,423 | $417,000 | $156,900 | $260,100 |
| 2016 | $9,099 | $417,000 | $156,900 | $260,100 |
| 2015 | $7,852 | $361,500 | $151,000 | $210,500 |
| 2014 | $8,736 | $364,000 | $151,000 | $213,000 |
| 2013 | $8,531 | $361,500 | $151,000 | $210,500 |
Source: Public Records
Map
Nearby Homes