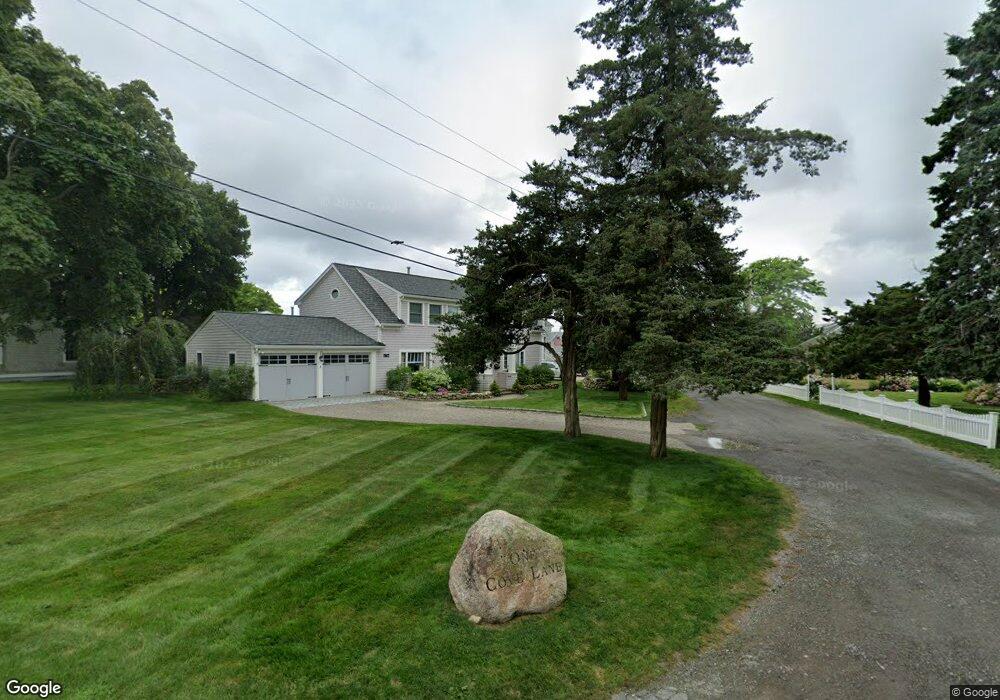
7 Cove Rd Pocasset, MA 02559
Pocasset NeighborhoodEstimated Value: $724,000 - $1,498,000
3
Beds
2
Baths
960
Sq Ft
$1,256/Sq Ft
Est. Value
About This Home
This home is located at 7 Cove Rd, Pocasset, MA 02559 and is currently estimated at $1,205,412, approximately $1,255 per square foot. 7 Cove Rd is a home located in Barnstable County with nearby schools including Bourne High School and Cadence Academy Preschool - Bourne.
Ownership History
Date
Name
Owned For
Owner Type
Purchase Details
Closed on
Apr 30, 2021
Sold by
Omalley Caroline A and Omalley Edward W
Bought by
Omalley Ft and Omalley
Current Estimated Value
Purchase Details
Closed on
Jan 31, 2018
Sold by
Candela Steven L and Candela Nancy E
Bought by
Omalley Edward W and Omally Caroline A
Home Financials for this Owner
Home Financials are based on the most recent Mortgage that was taken out on this home.
Original Mortgage
$396,000
Interest Rate
3.38%
Mortgage Type
New Conventional
Purchase Details
Closed on
Jul 13, 1995
Sold by
Kalick Harold A and Kalick Harold S
Bought by
Kalick Harold A and Kalick Kelly A
Home Financials for this Owner
Home Financials are based on the most recent Mortgage that was taken out on this home.
Original Mortgage
$157,500
Interest Rate
7.7%
Mortgage Type
Purchase Money Mortgage
Purchase Details
Closed on
Feb 16, 1989
Sold by
Kelley Diana M
Bought by
Kalick Harold A
Create a Home Valuation Report for This Property
The Home Valuation Report is an in-depth analysis detailing your home's value as well as a comparison with similar homes in the area
Home Values in the Area
Average Home Value in this Area
Purchase History
| Date | Buyer | Sale Price | Title Company |
|---|---|---|---|
| Omalley Ft | -- | None Available | |
| Omalley Ft | -- | None Available | |
| Omalley Edward W | $529,900 | -- | |
| Omalley Edward W | $529,900 | -- | |
| Candela Steven L | -- | -- | |
| Candela Steven L | -- | -- | |
| Kalick Harold A | $175,000 | -- | |
| Kalick Harold A | $175,000 | -- | |
| Kalick Harold A | $200,000 | -- |
Source: Public Records
Mortgage History
| Date | Status | Borrower | Loan Amount |
|---|---|---|---|
| Previous Owner | Omalley Edward W | $396,000 | |
| Previous Owner | Kalick Harold A | $115,000 | |
| Previous Owner | Kalick Harold A | $157,500 |
Source: Public Records
Tax History
| Year | Tax Paid | Tax Assessment Tax Assessment Total Assessment is a certain percentage of the fair market value that is determined by local assessors to be the total taxable value of land and additions on the property. | Land | Improvement |
|---|---|---|---|---|
| 2025 | $9,220 | $1,180,600 | $447,500 | $733,100 |
| 2024 | $8,608 | $1,073,300 | $426,100 | $647,200 |
| 2023 | $7,976 | $905,300 | $331,900 | $573,400 |
| 2022 | $7,192 | $712,800 | $260,300 | $452,500 |
| 2021 | $6,692 | $621,400 | $236,900 | $384,500 |
| 2020 | $4,109 | $382,600 | $234,700 | $147,900 |
| 2019 | $3,760 | $357,800 | $234,700 | $123,100 |
| 2018 | $3,614 | $342,900 | $229,200 | $113,700 |
| 2017 | $3,733 | $362,400 | $249,800 | $112,600 |
| 2016 | $3,402 | $334,800 | $227,100 | $107,700 |
| 2015 | $3,371 | $334,800 | $227,100 | $107,700 |
Source: Public Records
Map
Nearby Homes
- 7 Cove Ln
- 446 Barlows Landing Rd
- 11 Cove Ln
- 11 Cove Rd
- 450 Barlows Landing Rd
- 12 Cove Rd
- 12 Cove Ln
- 1 Cove Rd
- 15 Cove Rd
- 2 Cove Rd
- 440 Barlows Landing Rd
- 3 Sherman Ln
- 17 Cove Rd
- 17 Kenwood Rd
- 449 Barlows Landing Rd
- 449 Barlows Landing Rd Unit 1
- 20 Cove Rd
- 439 Barlows Landing Rd
- 10 Kenwood Rd
- 21 Kenwood Rd
Your Personal Tour Guide
Ask me questions while you tour the home.