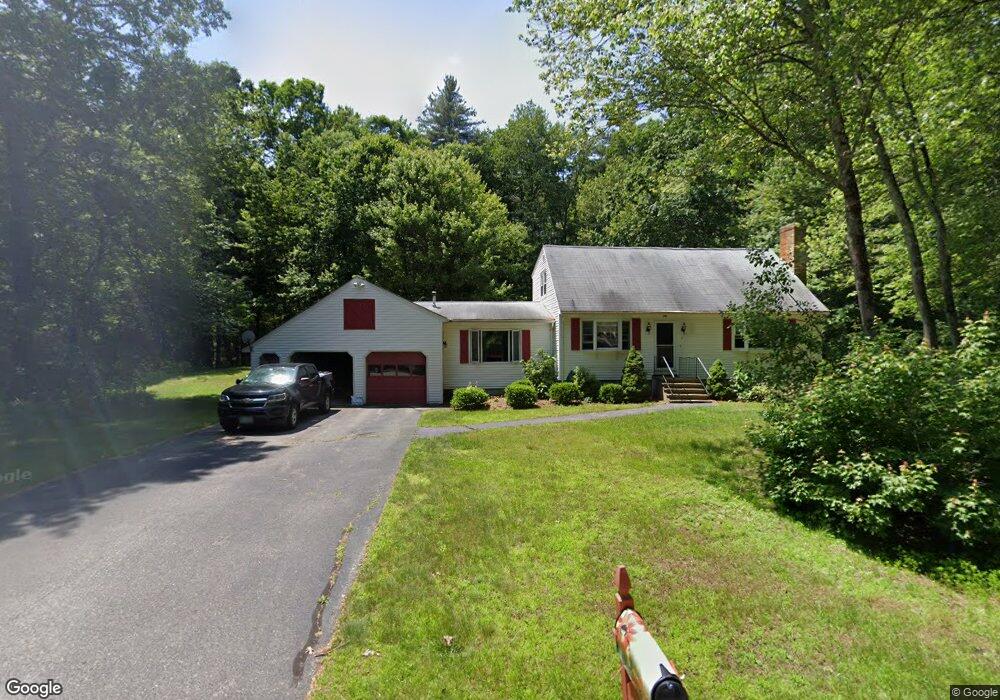
7 Craig Dr MerriMacK, NH 03054
Estimated Value: $586,479 - $656,000
4
Beds
2
Baths
2,267
Sq Ft
$276/Sq Ft
Est. Value
About This Home
This home is located at 7 Craig Dr, MerriMacK, NH 03054 and is currently estimated at $625,370, approximately $275 per square foot. 7 Craig Dr is a home located in Hillsborough County with nearby schools including Thorntons Ferry School, Merrimack Middle School, and James Mastricola Upper Elementary School.
Ownership History
Date
Name
Owned For
Owner Type
Purchase Details
Closed on
May 20, 2015
Sold by
Fuller Charles B and Fuller Patricia J
Bought by
Conti Fred M
Current Estimated Value
Home Financials for this Owner
Home Financials are based on the most recent Mortgage that was taken out on this home.
Original Mortgage
$268,580
Outstanding Balance
$206,754
Interest Rate
3.66%
Mortgage Type
New Conventional
Estimated Equity
$418,616
Create a Home Valuation Report for This Property
The Home Valuation Report is an in-depth analysis detailing your home's value as well as a comparison with similar homes in the area
Home Values in the Area
Average Home Value in this Area
Purchase History
| Date | Buyer | Sale Price | Title Company |
|---|---|---|---|
| Conti Fred M | $260,000 | -- |
Source: Public Records
Mortgage History
| Date | Status | Borrower | Loan Amount |
|---|---|---|---|
| Open | Conti Fred M | $268,580 | |
| Previous Owner | Conti Fred M | $200,000 |
Source: Public Records
Tax History Compared to Growth
Tax History
| Year | Tax Paid | Tax Assessment Tax Assessment Total Assessment is a certain percentage of the fair market value that is determined by local assessors to be the total taxable value of land and additions on the property. | Land | Improvement |
|---|---|---|---|---|
| 2024 | $8,158 | $394,300 | $220,200 | $174,100 |
| 2023 | $7,669 | $394,300 | $220,200 | $174,100 |
| 2022 | $6,853 | $394,300 | $220,200 | $174,100 |
| 2021 | $6,770 | $394,300 | $220,200 | $174,100 |
| 2020 | $6,946 | $288,700 | $154,200 | $134,500 |
| 2019 | $6,966 | $288,700 | $154,200 | $134,500 |
| 2018 | $6,963 | $288,700 | $154,200 | $134,500 |
| 2017 | $6,747 | $288,700 | $154,200 | $134,500 |
| 2016 | $6,579 | $288,700 | $154,200 | $134,500 |
| 2015 | $6,657 | $269,300 | $143,200 | $126,100 |
| 2014 | $6,487 | $269,300 | $143,200 | $126,100 |
| 2013 | $6,439 | $269,300 | $143,200 | $126,100 |
Source: Public Records
Map
Nearby Homes
- 27 Sarah Dr
- 40 Turkey Hill Rd
- 5 Lynn Dr
- 7 Beacon Dr
- 14 Mayflower Dr
- 23 Colonial Dr
- 77 E Ridge Rd
- 8 Highland Green Ln
- 7 Hadley Rd
- 3 Independence Dr
- 23 Pondview Dr
- 5 Fernwood Dr
- 98 Indian Rock Rd
- 1 Longwood Ln
- 14 Turnbuckle Ln Unit 38
- 5 Jennifer Dr Unit B
- 5 Jennifer Dr
- 5 Jennifer Dr Unit A
- 40 Captain Bannon Cir
- 14 Silver Doe Ln