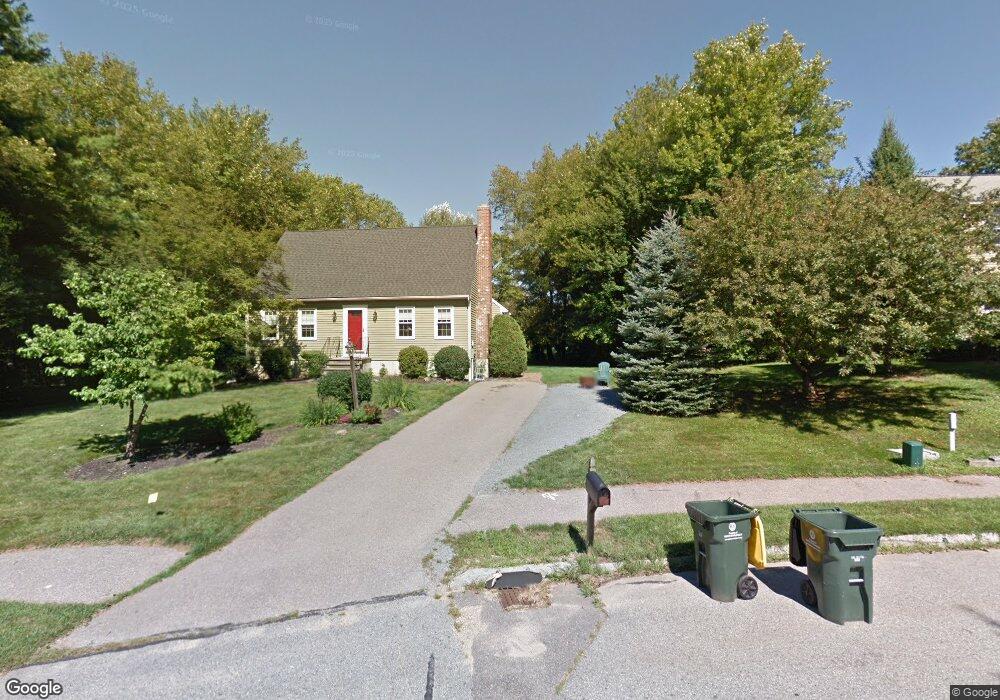
7 Damico Dr Franklin, MA 02038
Estimated Value: $700,000 - $870,000
4
Beds
4
Baths
2,265
Sq Ft
$355/Sq Ft
Est. Value
About This Home
This home is located at 7 Damico Dr, Franklin, MA 02038 and is currently estimated at $804,566, approximately $355 per square foot. 7 Damico Dr is a home located in Norfolk County with nearby schools including Helen Keller Elementary School, Annie Sullivan Middle School, and Franklin High School.
Ownership History
Date
Name
Owned For
Owner Type
Purchase Details
Closed on
Jul 31, 1998
Sold by
Andersen Craig O and Andersen Donna M
Bought by
Pulselli Joseph and Pulselli Lidia
Current Estimated Value
Home Financials for this Owner
Home Financials are based on the most recent Mortgage that was taken out on this home.
Original Mortgage
$167,900
Interest Rate
6.92%
Mortgage Type
Purchase Money Mortgage
Purchase Details
Closed on
Aug 31, 1993
Sold by
Birchwood Rt
Bought by
Andersen Craig O and Andersen Donna M
Home Financials for this Owner
Home Financials are based on the most recent Mortgage that was taken out on this home.
Original Mortgage
$134,200
Interest Rate
7.06%
Mortgage Type
Purchase Money Mortgage
Create a Home Valuation Report for This Property
The Home Valuation Report is an in-depth analysis detailing your home's value as well as a comparison with similar homes in the area
Home Values in the Area
Average Home Value in this Area
Purchase History
| Date | Buyer | Sale Price | Title Company |
|---|---|---|---|
| Pulselli Joseph | $209,900 | -- | |
| Andersen Craig O | $154,200 | -- |
Source: Public Records
Mortgage History
| Date | Status | Borrower | Loan Amount |
|---|---|---|---|
| Open | Andersen Craig O | $170,000 | |
| Closed | Andersen Craig O | $167,900 | |
| Previous Owner | Andersen Craig O | $134,200 | |
| Previous Owner | Andersen Craig O | $107,980 |
Source: Public Records
Tax History Compared to Growth
Tax History
| Year | Tax Paid | Tax Assessment Tax Assessment Total Assessment is a certain percentage of the fair market value that is determined by local assessors to be the total taxable value of land and additions on the property. | Land | Improvement |
|---|---|---|---|---|
| 2025 | $7,503 | $645,700 | $328,200 | $317,500 |
| 2024 | $7,460 | $632,700 | $328,200 | $304,500 |
| 2023 | $7,168 | $569,800 | $279,700 | $290,100 |
| 2022 | $6,703 | $477,100 | $220,300 | $256,800 |
| 2021 | $6,891 | $470,400 | $247,300 | $223,100 |
| 2020 | $5,978 | $412,000 | $237,200 | $174,800 |
| 2019 | $5,892 | $401,900 | $227,000 | $174,900 |
| 2018 | $5,494 | $375,000 | $218,900 | $156,100 |
| 2017 | $5,231 | $358,800 | $202,700 | $156,100 |
| 2016 | $5,406 | $372,800 | $217,600 | $155,200 |
| 2015 | $5,371 | $361,900 | $206,700 | $155,200 |
| 2014 | $4,862 | $336,500 | $181,300 | $155,200 |
Source: Public Records
Map
Nearby Homes
- 70 Daniels St
- 33 Daniels St
- 10 Silver Fox Rd
- 312 Eagles Nest Way Unit 312
- 91 Oliver Pond Cir Unit 3
- 83 Oliver Pond Cir Unit 7
- 48 Leanne Way Unit 48
- 99 Leland Rd
- 10 Populatic Street Extension
- 24 Shayne Rd Unit 219
- 732 Lincoln St
- 204 Lincoln St
- 324 Pleasant St
- 2 Kayla Dr
- 2 Skyline Dr
- 41 Myrtle St
- 266 Pleasant St
- 41 Kimberlee Ave
- 336 Maple St
- 12 Ariana Ln