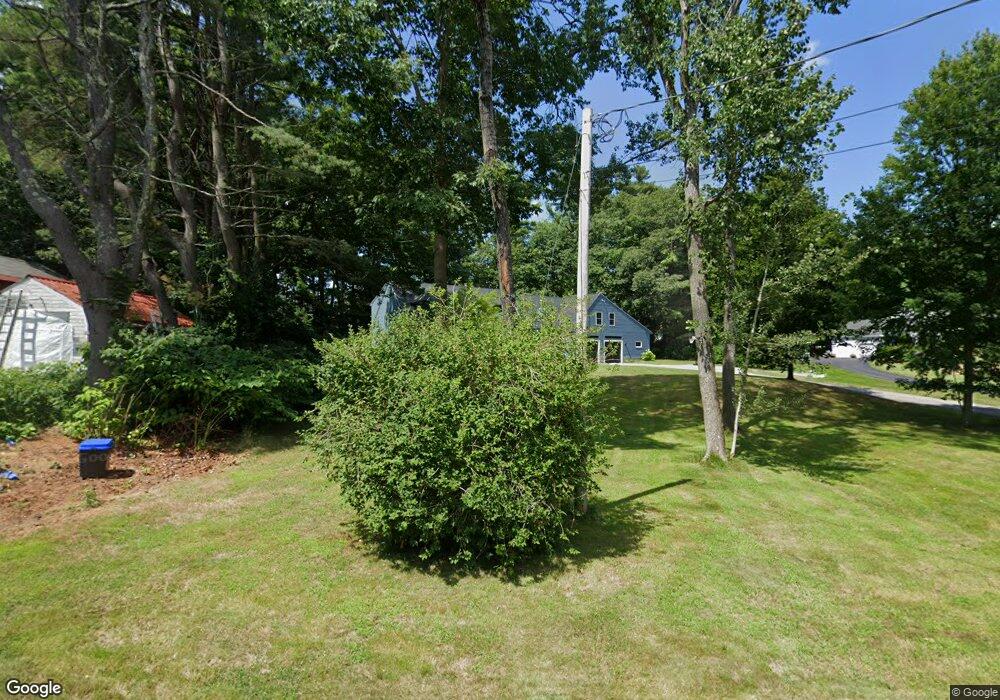
7 Ferry Ln Biddeford, ME 04005
South Biddeford NeighborhoodEstimated Value: $831,129 - $1,061,000
4
Beds
3
Baths
2,720
Sq Ft
$358/Sq Ft
Est. Value
About This Home
This home is located at 7 Ferry Ln, Biddeford, ME 04005 and is currently estimated at $972,782, approximately $357 per square foot. 7 Ferry Ln is a home located in York County with nearby schools including John F Kennedy Memorial School, Biddeford Primary School, and Biddeford Intermediate School.
Ownership History
Date
Name
Owned For
Owner Type
Purchase Details
Closed on
Mar 3, 2017
Sold by
James K Butler Lt
Bought by
Howard Joan M and Lennerton Lauren A
Current Estimated Value
Home Financials for this Owner
Home Financials are based on the most recent Mortgage that was taken out on this home.
Original Mortgage
$306,000
Outstanding Balance
$253,185
Interest Rate
4.09%
Mortgage Type
New Conventional
Estimated Equity
$719,597
Purchase Details
Closed on
Feb 4, 2015
Sold by
Butler James K and Butler Maureen
Bought by
James K Butler Lt
Create a Home Valuation Report for This Property
The Home Valuation Report is an in-depth analysis detailing your home's value as well as a comparison with similar homes in the area
Home Values in the Area
Average Home Value in this Area
Purchase History
| Date | Buyer | Sale Price | Title Company |
|---|---|---|---|
| Howard Joan M | -- | -- | |
| James K Butler Lt | -- | -- |
Source: Public Records
Mortgage History
| Date | Status | Borrower | Loan Amount |
|---|---|---|---|
| Open | Howard Joan M | $306,000 |
Source: Public Records
Tax History Compared to Growth
Tax History
| Year | Tax Paid | Tax Assessment Tax Assessment Total Assessment is a certain percentage of the fair market value that is determined by local assessors to be the total taxable value of land and additions on the property. | Land | Improvement |
|---|---|---|---|---|
| 2024 | $9,746 | $685,400 | $194,400 | $491,000 |
| 2023 | $8,953 | $682,400 | $191,400 | $491,000 |
| 2022 | $9,428 | $574,500 | $132,900 | $441,600 |
| 2021 | $8,829 | $484,300 | $114,500 | $369,800 |
| 2020 | $8,710 | $434,400 | $96,400 | $338,000 |
| 2019 | $8,679 | $434,400 | $96,400 | $338,000 |
| 2018 | $7,560 | $434,400 | $96,400 | $338,000 |
| 2017 | $6,954 | $422,400 | $96,400 | $326,000 |
| 2016 | $2,329 | $420,300 | $96,400 | $323,900 |
| 2015 | $7,989 | $420,300 | $96,400 | $323,900 |
| 2014 | $7,792 | $420,300 | $96,400 | $323,900 |
| 2013 | -- | $401,800 | $78,500 | $323,300 |
Source: Public Records
Map
Nearby Homes