7 Filare Irvine, CA 92620
Northwood NeighborhoodEstimated Value: $1,169,725 - $1,473,000
2
Beds
3
Baths
1,425
Sq Ft
$916/Sq Ft
Est. Value
About This Home
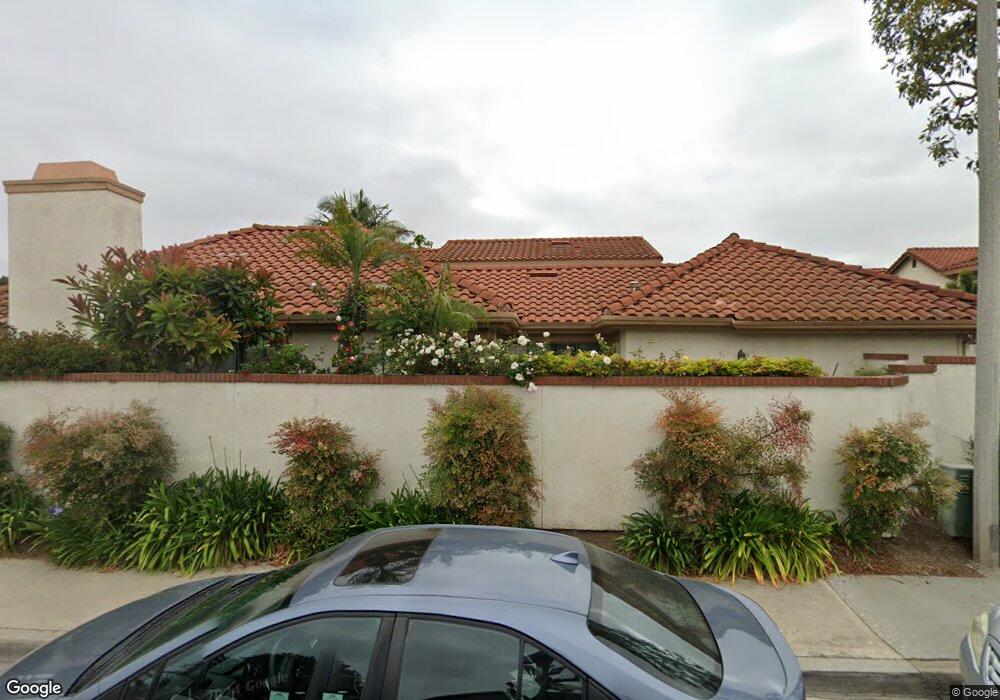
This home is located at 7 Filare, Irvine, CA 92620 and is currently estimated at $1,305,931, approximately $916 per square foot. 7 Filare is a home located in Orange County with nearby schools including Brywood Elementary School, Sierra Vista Middle School, and Northwood High School.
Ownership History
Date
Name
Owned For
Owner Type
Purchase Details
Closed on
Jan 5, 2007
Sold by
Bloomberg David B and Bloomberg Elynne M
Bought by
Bloomberg Rachels
Current Estimated Value
Purchase Details
Closed on
May 6, 2002
Sold by
Lim Jae Sol and Lim Min Young
Bought by
Bloomberg David B and Bloomberg Lynne M
Home Financials for this Owner
Home Financials are based on the most recent Mortgage that was taken out on this home.
Original Mortgage
$225,000
Interest Rate
6.89%
Purchase Details
Closed on
Jan 18, 1995
Sold by
Senior David B and Senior Harriet E
Bought by
Lim Jae Sol and Lim Min Young
Home Financials for this Owner
Home Financials are based on the most recent Mortgage that was taken out on this home.
Original Mortgage
$184,500
Interest Rate
9.2%
Create a Home Valuation Report for This Property
The Home Valuation Report is an in-depth analysis detailing your home's value as well as a comparison with similar homes in the area
Home Values in the Area
Average Home Value in this Area
Purchase History
| Date | Buyer | Sale Price | Title Company |
|---|---|---|---|
| Bloomberg Rachels | -- | None Available | |
| Bloomberg David B | $359,000 | -- | |
| Lim Jae Sol | $205,000 | Commonwealth Land Title |
Source: Public Records
Mortgage History
| Date | Status | Borrower | Loan Amount |
|---|---|---|---|
| Previous Owner | Bloomberg David B | $225,000 | |
| Previous Owner | Lim Jae Sol | $184,500 |
Source: Public Records
Tax History
| Year | Tax Paid | Tax Assessment Tax Assessment Total Assessment is a certain percentage of the fair market value that is determined by local assessors to be the total taxable value of land and additions on the property. | Land | Improvement |
|---|---|---|---|---|
| 2025 | $5,626 | $530,341 | $351,883 | $178,458 |
| 2024 | $5,626 | $519,943 | $344,984 | $174,959 |
| 2023 | $5,480 | $509,749 | $338,220 | $171,529 |
| 2022 | $5,372 | $499,754 | $331,588 | $168,166 |
| 2021 | $5,247 | $489,955 | $325,086 | $164,869 |
| 2020 | $5,216 | $484,932 | $321,753 | $163,179 |
| 2019 | $5,100 | $475,424 | $315,444 | $159,980 |
| 2018 | $5,007 | $466,102 | $309,258 | $156,844 |
| 2017 | $4,903 | $456,963 | $303,194 | $153,769 |
| 2016 | $4,689 | $448,003 | $297,249 | $150,754 |
| 2015 | $4,618 | $441,274 | $292,784 | $148,490 |
| 2014 | $4,528 | $432,631 | $287,049 | $145,582 |
Source: Public Records
Map
Nearby Homes
Your Personal Tour Guide
Ask me questions while you tour the home.