7 Fir St Unit 1 Jersey City, NJ 07305
West Side NeighborhoodEstimated Value: $658,000 - $771,000
3
Beds
3
Baths
2,000
Sq Ft
$355/Sq Ft
Est. Value
About This Home
This home is located at 7 Fir St Unit 1, Jersey City, NJ 07305 and is currently estimated at $710,331, approximately $355 per square foot. 7 Fir St Unit 1 is a home located in Hudson County with nearby schools including James F. Murray School - P.S. 38, Henry Snyder High School, and Liberty High School.
Ownership History
Date
Name
Owned For
Owner Type
Purchase Details
Closed on
Mar 11, 2009
Sold by
Acon Alex and Acon Patricia
Bought by
Kibrea S.M. and Kibrea Dilruba
Current Estimated Value
Home Financials for this Owner
Home Financials are based on the most recent Mortgage that was taken out on this home.
Original Mortgage
$424,297
Outstanding Balance
$269,938
Interest Rate
5.14%
Mortgage Type
FHA
Estimated Equity
$440,393
Purchase Details
Closed on
May 26, 2005
Sold by
Son Myung Jun and Son Kyung Hee
Bought by
Acon Alex and Fung Patricia
Home Financials for this Owner
Home Financials are based on the most recent Mortgage that was taken out on this home.
Original Mortgage
$359,000
Interest Rate
5.79%
Mortgage Type
Fannie Mae Freddie Mac
Purchase Details
Closed on
Jun 26, 2000
Sold by
Castro Rhodora D and Castro Ferdinand
Bought by
Son Myung Jun and Son Kyung Hee
Home Financials for this Owner
Home Financials are based on the most recent Mortgage that was taken out on this home.
Original Mortgage
$183,700
Interest Rate
8.55%
Create a Home Valuation Report for This Property
The Home Valuation Report is an in-depth analysis detailing your home's value as well as a comparison with similar homes in the area
Home Values in the Area
Average Home Value in this Area
Purchase History
| Date | Buyer | Sale Price | Title Company |
|---|---|---|---|
| Kibrea S.M. | $450,000 | -- | |
| Acon Alex | $450,000 | Vested Title Inc | |
| Son Myung Jun | $247,000 | -- |
Source: Public Records
Mortgage History
| Date | Status | Borrower | Loan Amount |
|---|---|---|---|
| Open | Kibrea S.M. | $424,297 | |
| Previous Owner | Acon Alex | $359,000 | |
| Previous Owner | Son Myung Jun | $183,700 |
Source: Public Records
Tax History Compared to Growth
Tax History
| Year | Tax Paid | Tax Assessment Tax Assessment Total Assessment is a certain percentage of the fair market value that is determined by local assessors to be the total taxable value of land and additions on the property. | Land | Improvement |
|---|---|---|---|---|
| 2025 | $10,412 | $466,300 | $108,000 | $358,300 |
| 2024 | $10,478 | $466,300 | $108,000 | $358,300 |
| 2023 | $10,478 | $466,300 | $108,000 | $358,300 |
| 2022 | $9,876 | $466,300 | $108,000 | $358,300 |
| 2021 | $7,479 | $466,300 | $108,000 | $358,300 |
| 2020 | $7,507 | $466,300 | $108,000 | $358,300 |
| 2019 | $7,181 | $466,300 | $108,000 | $358,300 |
| 2018 | $1,923 | $466,300 | $108,000 | $358,300 |
| 2017 | $10,078 | $129,200 | $13,400 | $115,800 |
| 2016 | $9,950 | $129,200 | $13,400 | $115,800 |
| 2015 | $9,667 | $129,200 | $13,400 | $115,800 |
| 2014 | $9,605 | $129,200 | $13,400 | $115,800 |
Source: Public Records
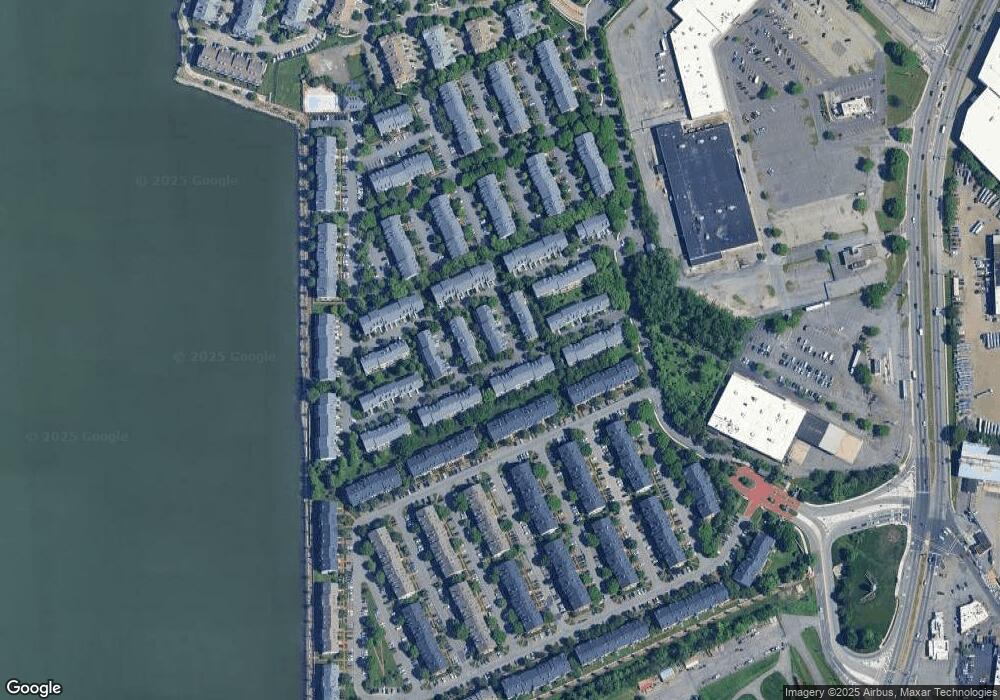
Map
Nearby Homes
- 16 Cypress St Unit 46E
- 13 Cypress St Unit 1
- 1 Droyers Pointe Blvd Unit 51A
- 22 Redwood St Unit 51U
- 71 Cottonwood St
- 47 Dogwood St
- 4 Persimmon Ct Unit 45D
- 3 Persimmon Ct Unit 45
- 5 Redwood St Unit 55E
- 3 Atlas Ct Unit 1019D
- 127 Cherry St Unit 17X
- 137 Cottonwood St
- 36 Tottenham Ct Unit A2
- 339 Stevens Ave
- 141A Suburbia Terrace
- 135B Suburbia Terrace
- 382 Cator Ave
- 130 W Side Ave
- 30 Suburbia Dr
- 400 Woodlawn Ave