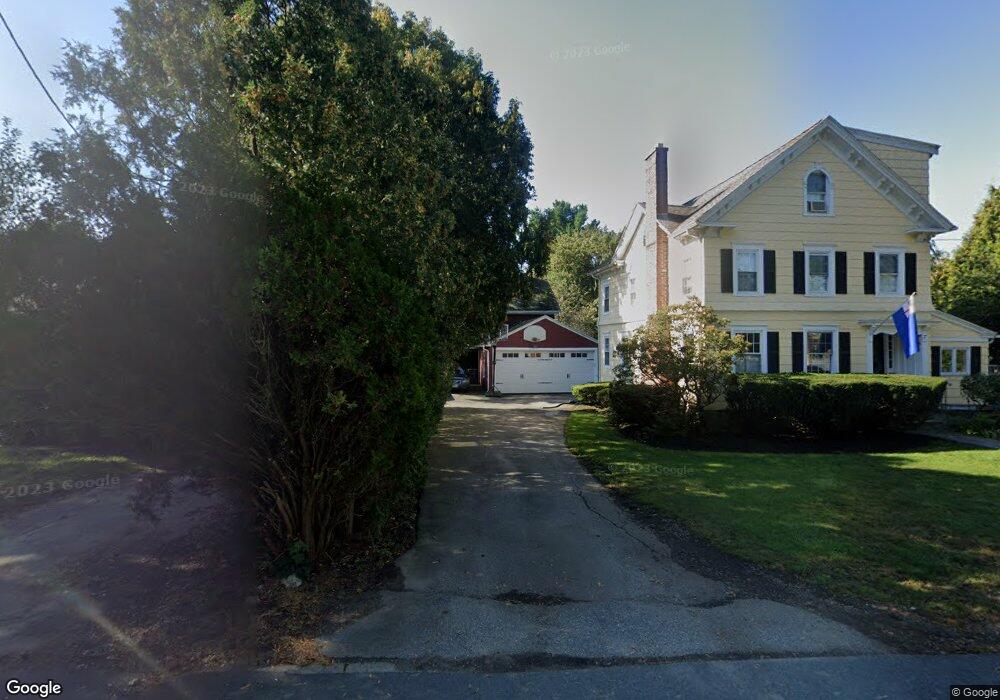
7 Foster Cir Andover, MA 01810
East Andover NeighborhoodEstimated Value: $1,105,000 - $1,249,000
4
Beds
3
Baths
2,419
Sq Ft
$486/Sq Ft
Est. Value
About This Home
This home is located at 7 Foster Cir, Andover, MA 01810 and is currently estimated at $1,175,925, approximately $486 per square foot. 7 Foster Cir is a home located in Essex County with nearby schools including Bancroft Elementary School, Doherty Middle School, and Andover High School.
Ownership History
Date
Name
Owned For
Owner Type
Purchase Details
Closed on
Sep 3, 1999
Sold by
Egertson Eric C and Egertson Robina W
Bought by
Chisholm Mark A and Anderson Theresa L
Current Estimated Value
Home Financials for this Owner
Home Financials are based on the most recent Mortgage that was taken out on this home.
Original Mortgage
$225,000
Interest Rate
7.5%
Mortgage Type
Purchase Money Mortgage
Purchase Details
Closed on
Sep 25, 1992
Sold by
Bomba Frank C
Bought by
Egartson Eric C
Create a Home Valuation Report for This Property
The Home Valuation Report is an in-depth analysis detailing your home's value as well as a comparison with similar homes in the area
Home Values in the Area
Average Home Value in this Area
Purchase History
| Date | Buyer | Sale Price | Title Company |
|---|---|---|---|
| Chisholm Mark A | $325,000 | -- | |
| Chisholm Mark A | $325,000 | -- | |
| Egartson Eric C | $245,000 | -- | |
| Egartson Eric C | $245,000 | -- |
Source: Public Records
Mortgage History
| Date | Status | Borrower | Loan Amount |
|---|---|---|---|
| Open | Egartson Eric C | $193,695 | |
| Closed | Egartson Eric C | $223,000 | |
| Closed | Egartson Eric C | $225,000 |
Source: Public Records
Tax History
| Year | Tax Paid | Tax Assessment Tax Assessment Total Assessment is a certain percentage of the fair market value that is determined by local assessors to be the total taxable value of land and additions on the property. | Land | Improvement |
|---|---|---|---|---|
| 2024 | $12,020 | $933,200 | $475,000 | $458,200 |
| 2023 | $11,500 | $841,900 | $427,800 | $414,100 |
| 2022 | $11,042 | $756,300 | $378,600 | $377,700 |
| 2021 | $10,576 | $691,700 | $344,300 | $347,400 |
| 2020 | $10,144 | $675,800 | $335,900 | $339,900 |
| 2019 | $9,396 | $615,300 | $297,500 | $317,800 |
| 2018 | $8,968 | $573,400 | $280,600 | $292,800 |
| 2017 | $8,584 | $565,500 | $275,200 | $290,300 |
| 2016 | $8,117 | $547,700 | $257,400 | $290,300 |
| 2015 | $7,811 | $521,800 | $247,600 | $274,200 |
Source: Public Records
Map
Nearby Homes
- Lot 7 Weeping Willow Dr
- 33 Chestnut St Unit 2
- 1 Sweeney Ct
- 5 Lewis St
- 96 N Main St Unit 3
- 100.5 Main St Unit Q
- 2 Powder Mill Square Unit 2B
- 50C Washington Park Dr Unit 10
- 181 High St Unit 1
- 1 Longwood Dr Unit 105
- 15 Alcott Way
- 3 Torr St
- 16 Balmoral St Unit 214
- 105 Central St
- 52 Salem St
- 42 York St
- 35 Peters St
- 53 Salem St
- 28 Stirling St
- 30 Canterbury St
Your Personal Tour Guide
Ask me questions while you tour the home.