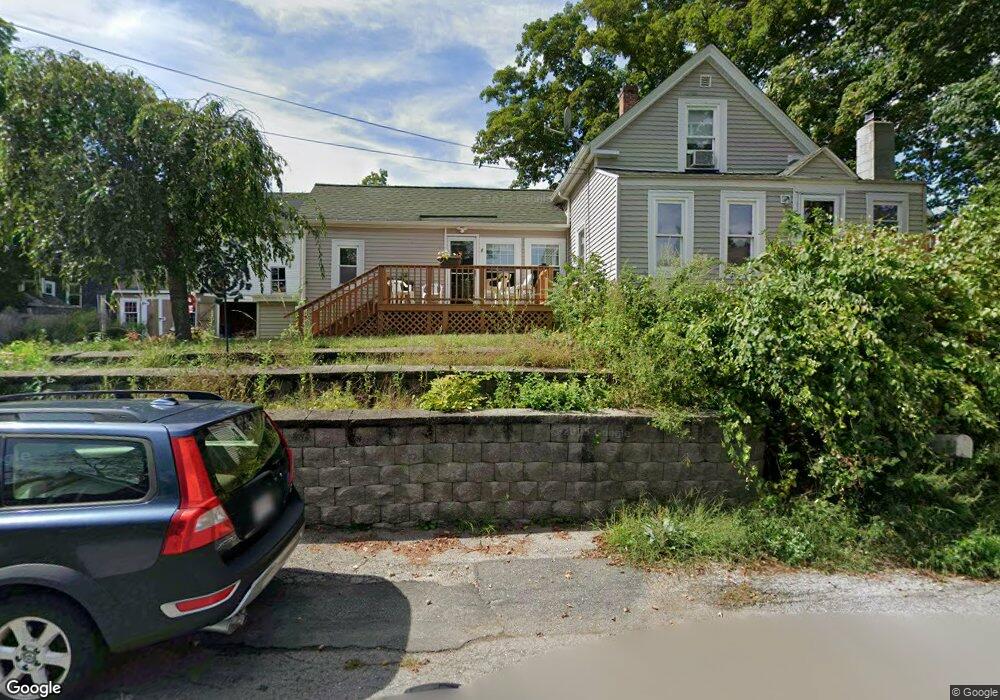
7 Foster St Pepperell, MA 01463
Estimated Value: $361,000 - $401,000
4
Beds
3
Baths
1,304
Sq Ft
$288/Sq Ft
Est. Value
About This Home
This home is located at 7 Foster St, Pepperell, MA 01463 and is currently estimated at $375,808, approximately $288 per square foot. 7 Foster St is a home located in Middlesex County with nearby schools including North Middlesex Regional High School, Pepperell Christian Academy, and Maple Dene & Moppet School.
Ownership History
Date
Name
Owned For
Owner Type
Purchase Details
Closed on
Sep 24, 2002
Sold by
Dow Leonard W
Bought by
Goulding Gregory
Current Estimated Value
Home Financials for this Owner
Home Financials are based on the most recent Mortgage that was taken out on this home.
Original Mortgage
$147,250
Outstanding Balance
$62,050
Interest Rate
6.36%
Mortgage Type
Purchase Money Mortgage
Estimated Equity
$313,758
Create a Home Valuation Report for This Property
The Home Valuation Report is an in-depth analysis detailing your home's value as well as a comparison with similar homes in the area
Home Values in the Area
Average Home Value in this Area
Purchase History
| Date | Buyer | Sale Price | Title Company |
|---|---|---|---|
| Goulding Gregory | $155,000 | -- |
Source: Public Records
Mortgage History
| Date | Status | Borrower | Loan Amount |
|---|---|---|---|
| Open | Goulding Gregory | $147,250 |
Source: Public Records
Tax History Compared to Growth
Tax History
| Year | Tax Paid | Tax Assessment Tax Assessment Total Assessment is a certain percentage of the fair market value that is determined by local assessors to be the total taxable value of land and additions on the property. | Land | Improvement |
|---|---|---|---|---|
| 2025 | $4,392 | $300,200 | $109,500 | $190,700 |
| 2024 | $4,308 | $300,200 | $109,500 | $190,700 |
| 2023 | $4,357 | $287,800 | $109,500 | $178,300 |
| 2022 | $4,037 | $235,400 | $86,500 | $148,900 |
| 2021 | $3,957 | $220,800 | $74,900 | $145,900 |
| 2020 | $3,731 | $219,700 | $74,900 | $144,800 |
| 2019 | $3,401 | $205,000 | $74,900 | $130,100 |
| 2018 | $12,527 | $189,600 | $74,900 | $114,700 |
| 2017 | $2,790 | $175,600 | $69,200 | $106,400 |
| 2016 | $2,772 | $167,700 | $69,200 | $98,500 |
| 2015 | $2,675 | $167,700 | $69,200 | $98,500 |
| 2014 | $2,606 | $164,300 | $69,200 | $95,100 |
Source: Public Records
Map
Nearby Homes
- 31 Prospect St
- 38 River Rd Unit 11
- 4 Parker Hill Way Unit C
- 10 Tucker St
- 28-30 Groton St
- 9 Tarbell St
- 35 Hollis St Unit 1
- 38 Tarbell St Unit 5B
- 7 Maureens Way
- 55 Park St
- 6 Mason St Unit 31
- 31 Heald St
- 208 North St
- 5 June St
- 20 A Legacy Ln Unit 20A
- 24 Unkety Brook Way
- 120 Townsend St Unit 1
- 139 Nashua Rd
- 18 Maple St Unit 14
- 18 Maple St Unit 30