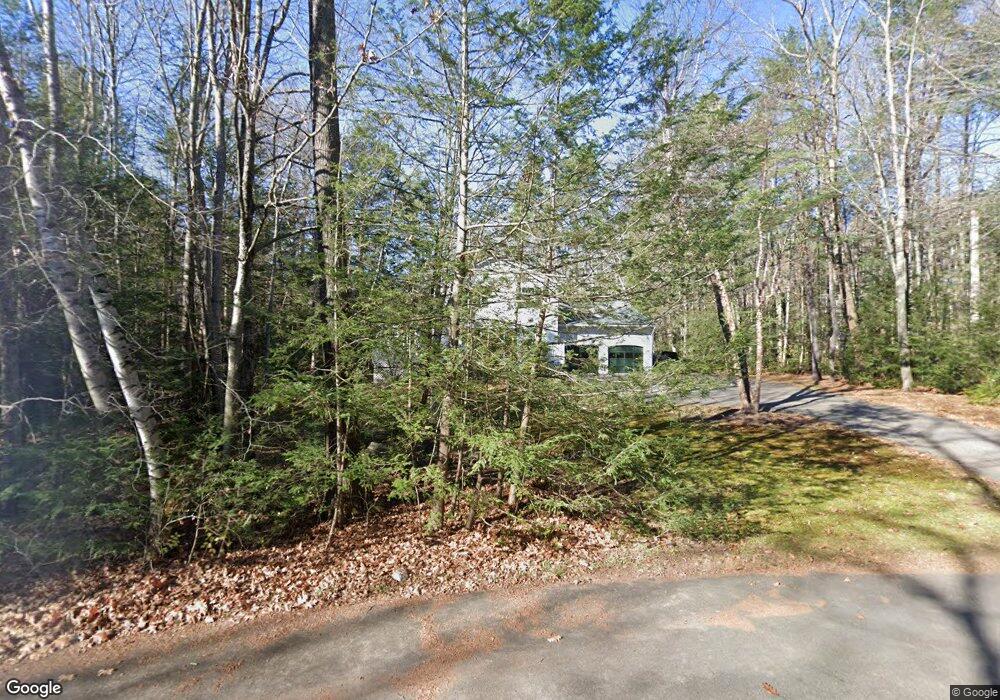
7 Fox Chapel Ct Exeter, NH 03833
Exeter AreaEstimated Value: $684,000 - $1,070,000
About This Home
This home is located at 7 Fox Chapel Ct, Exeter, NH 03833 and is currently estimated at $903,634, approximately $284 per square foot. 7 Fox Chapel Ct is a home located in Rockingham County with nearby schools including Main Street School, Lincoln Street Elementary School, and Cooperative Middle School.
Ownership History
We collect this data history from publicly available records. To have your information removed, we recommend requesting removal directly through your county’s website.
Purchase Details
Purchase Details
Home Values in the Area
Average Home Value in this Area
Purchase History
We collect this data history from publicly available records. To have your information removed, we recommend requesting removal directly through your county’s website.
| Date | Buyer | Sale Price | Title Company |
|---|---|---|---|
| -- | -- | ||
| $385,000 | -- |
Mortgage History
We collect this data history from publicly available records. To have your information removed, we recommend requesting removal directly through your county’s website.
| Date | Status | Borrower | Loan Amount |
|---|---|---|---|
| Open | $69,000 | ||
| Previous Owner | $200,000 |
Tax History
We collect this data history from publicly available records. To have your information removed, we recommend requesting removal directly through your county’s website.
| Year | Tax Paid | Tax Assessment Tax Assessment Total Assessment is a certain percentage of the fair market value that is determined by local assessors to be the total taxable value of land and additions on the property. | Land | Improvement |
|---|---|---|---|---|
| 2025 | $15,357 | $818,600 | $307,300 | $511,300 |
| 2024 | $14,563 | $818,600 | $307,300 | $511,300 |
| 2023 | $13,146 | $490,900 | $181,300 | $309,600 |
| 2022 | $12,150 | $490,900 | $181,300 | $309,600 |
| 2021 | $11,071 | $461,100 | $181,300 | $279,800 |
| 2020 | $11,292 | $461,100 | $181,300 | $279,800 |
| 2019 | $10,764 | $461,100 | $181,300 | $279,800 |
| 2018 | $11,572 | $420,800 | $133,800 | $287,000 |
| 2017 | $9,976 | $420,800 | $133,800 | $287,000 |
| 2016 | $9,834 | $420,800 | $133,800 | $287,000 |
| 2015 | $11,733 | $459,400 | $133,800 | $325,600 |
| 2014 | $9,804 | $376,200 | $134,000 | $242,200 |
| 2013 | $10,834 | $416,200 | $134,000 | $282,200 |
| 2011 | $10,522 | $416,200 | $134,000 | $282,200 |
Map
- 0 High St Unit 2
- 5 Ridgewood Terrace
- 3 Portsmouth Ave
- 30 River St
- 34 & 30 River St
- 34 River St
- 10 String Bridge
- 105 Portsmouth Ave Unit 31
- - New Hampshire 27
- - New Hampshire 27
- - New Hampshire 27
- 32 Willey Creek Rd Unit 303
- 14 Hampton Falls Rd
- 27 Hayes Park
- 22 Pine St
- 39 Acadia Ln
- 46 Acadia Ln Unit 58
- 8 Pine Grove Rd
- 131 Court St Unit 17
- 60 Main St
Ask me questions while you tour the home.