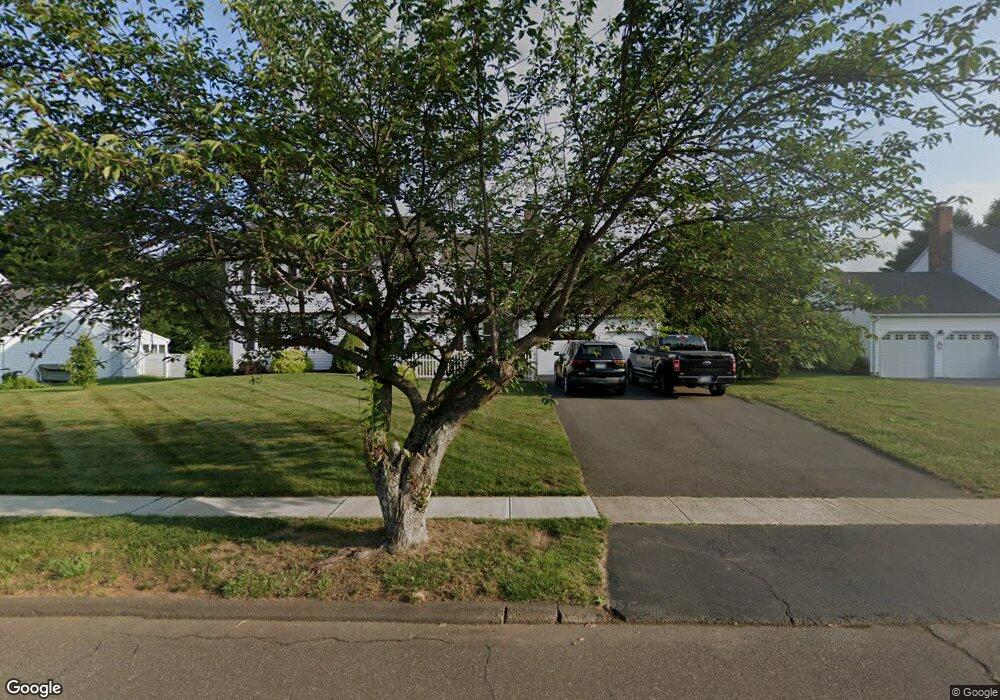
7 Hayledge Ct Wallingford, CT 06492
Estimated Value: $618,492 - $709,000
4
Beds
3
Baths
2,256
Sq Ft
$292/Sq Ft
Est. Value
About This Home
This home is located at 7 Hayledge Ct, Wallingford, CT 06492 and is currently estimated at $658,123, approximately $291 per square foot. 7 Hayledge Ct is a home located in New Haven County with nearby schools including Highland Elementary School, Mary G. Fritz Elementary School, and James H. Moran Middle School.
Ownership History
Date
Name
Owned For
Owner Type
Purchase Details
Closed on
Aug 21, 2009
Sold by
Fracassini Kathleen S
Bought by
Peterson Scott
Current Estimated Value
Home Financials for this Owner
Home Financials are based on the most recent Mortgage that was taken out on this home.
Original Mortgage
$157,500
Interest Rate
5.19%
Purchase Details
Closed on
Jul 30, 1992
Sold by
Seccombe Charles and Seccombe Renee
Bought by
Fracassini Donald C and Fracassi Kathleen S
Purchase Details
Closed on
May 4, 1988
Sold by
Sattel James C
Bought by
Secoombe Charles
Purchase Details
Closed on
Feb 13, 1987
Sold by
Ravenswood Prop Inc
Bought by
Sattel James C
Create a Home Valuation Report for This Property
The Home Valuation Report is an in-depth analysis detailing your home's value as well as a comparison with similar homes in the area
Home Values in the Area
Average Home Value in this Area
Purchase History
| Date | Buyer | Sale Price | Title Company |
|---|---|---|---|
| Peterson Scott | $377,500 | -- | |
| Peterson Scott | $377,500 | -- | |
| Fracassini Donald C | $242,000 | -- | |
| Fracassini Donald C | $242,000 | -- | |
| Secoombe Charles | $242,000 | -- | |
| Sattel James C | $178,675 | -- |
Source: Public Records
Mortgage History
| Date | Status | Borrower | Loan Amount |
|---|---|---|---|
| Open | Sattel James C | $100,000 | |
| Closed | Sattel James C | $155,800 | |
| Closed | Sattel James C | $157,500 |
Source: Public Records
Tax History
| Year | Tax Paid | Tax Assessment Tax Assessment Total Assessment is a certain percentage of the fair market value that is determined by local assessors to be the total taxable value of land and additions on the property. | Land | Improvement |
|---|---|---|---|---|
| 2025 | $8,744 | $362,500 | $102,300 | $260,200 |
| 2024 | $7,889 | $257,300 | $85,200 | $172,100 |
| 2023 | $7,549 | $257,300 | $85,200 | $172,100 |
| 2022 | $7,472 | $257,300 | $85,200 | $172,100 |
| 2021 | $10,753 | $257,300 | $85,200 | $172,100 |
| 2020 | $7,146 | $244,800 | $96,300 | $148,500 |
| 2019 | $12,146 | $244,800 | $96,300 | $148,500 |
| 2018 | $12,146 | $244,800 | $96,300 | $148,500 |
| 2017 | $11,912 | $244,800 | $96,300 | $148,500 |
| 2016 | $6,827 | $244,800 | $96,300 | $148,500 |
| 2015 | $6,755 | $245,900 | $96,300 | $149,600 |
| 2014 | $6,612 | $245,900 | $96,300 | $149,600 |
Source: Public Records
Map
Nearby Homes
- 26 Cassella Dr
- 1 Bertini Ln
- 13 Bailey Ave
- 201 New Cheshire Rd
- 4 Gregory Rd
- 15 Hanover St
- 30 Crestview Terrace
- 23 Ridgefield Rd
- 54 High St
- 396 Main St Unit 2
- 380 Main St Unit 3
- 380 Main St Unit 7
- 380 Main St Unit 4
- 380 Main St Unit 16
- 380 Main St Unit 13
- 380 Main St Unit 14
- 100 Spice Hill Dr
- 68 Lynn Dr
- 44 Douglas Dr
- 84 Staffordshire Commons Dr
- 9 Hayledge Ct
- 5 Hayledge Ct
- 11 Hayledge Ct
- 3 Hayledge Ct
- 6 Hayledge Ct
- 8 Hayledge Ct
- 15 Hayledge Ct
- 301 Highland Ave
- 4 Hayledge Ct
- 10 Hayledge Ct
- 303 Highland Ave
- 299 Highland Ave
- 1 Hayledge Ct
- 2 Hayledge Ct
- 12 Hayledge Ct
- 297 Highland Ave
- 4 Shangri Ln
- 37 Buttonwood Cir
- 295 Highland Ave
- 307 Highland Ave
Your Personal Tour Guide
Ask me questions while you tour the home.