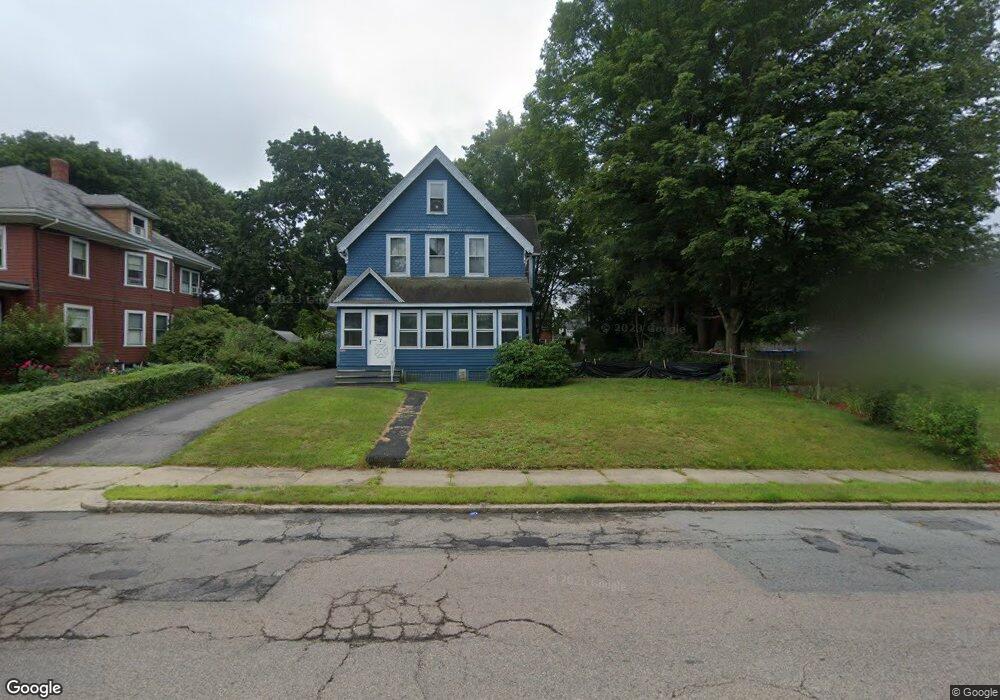
7 Holden St Attleboro, MA 02703
Estimated Value: $533,227 - $648,000
3
Beds
2
Baths
2,241
Sq Ft
$268/Sq Ft
Est. Value
About This Home
This home is located at 7 Holden St, Attleboro, MA 02703 and is currently estimated at $601,307, approximately $268 per square foot. 7 Holden St is a home located in Bristol County with nearby schools including Thomas E. Willett School, Cyril K. Brennan Middle School, and Attleboro High School.
Ownership History
Date
Name
Owned For
Owner Type
Purchase Details
Closed on
Mar 14, 2025
Sold by
Marcure Norman J
Bought by
Marcure Norman J and Marcure Hikaru M
Current Estimated Value
Purchase Details
Closed on
Oct 25, 2013
Sold by
Marcure Norman J and Marcure Jane A
Bought by
Marcure Norman J and Marcure Jane A
Create a Home Valuation Report for This Property
The Home Valuation Report is an in-depth analysis detailing your home's value as well as a comparison with similar homes in the area
Home Values in the Area
Average Home Value in this Area
Purchase History
| Date | Buyer | Sale Price | Title Company |
|---|---|---|---|
| Marcure Norman J | -- | None Available | |
| Marcure Norman J | -- | None Available | |
| Marcure Norman J | -- | -- | |
| Marcure Norman J | -- | -- |
Source: Public Records
Mortgage History
| Date | Status | Borrower | Loan Amount |
|---|---|---|---|
| Previous Owner | Marcure Norman J | $61,000 |
Source: Public Records
Tax History
| Year | Tax Paid | Tax Assessment Tax Assessment Total Assessment is a certain percentage of the fair market value that is determined by local assessors to be the total taxable value of land and additions on the property. | Land | Improvement |
|---|---|---|---|---|
| 2025 | $5,340 | $425,500 | $130,700 | $294,800 |
| 2024 | $5,352 | $420,400 | $130,700 | $289,700 |
| 2023 | $5,139 | $375,400 | $118,900 | $256,500 |
| 2022 | $4,964 | $343,500 | $113,200 | $230,300 |
| 2021 | $4,850 | $327,700 | $108,800 | $218,900 |
| 2020 | $4,783 | $328,500 | $105,700 | $222,800 |
| 2019 | $4,441 | $313,600 | $103,600 | $210,000 |
| 2018 | $4,153 | $280,200 | $100,600 | $179,600 |
| 2017 | $4,121 | $283,200 | $100,600 | $182,600 |
| 2016 | $3,797 | $256,200 | $98,800 | $157,400 |
| 2015 | $3,411 | $231,900 | $98,800 | $133,100 |
| 2014 | $3,323 | $223,800 | $94,100 | $129,700 |
Source: Public Records
Map
Nearby Homes
- 26 West St
- 20 Elizabeth St
- 149 N Main St Unit B
- 10 John St
- 15 North Ave
- 10 Hazelwood Ct
- 747 N Main St
- 0 Rosedale Ln Unit 73469293
- 32 Park St Unit 4
- 64 Mechanic St Unit 3
- 64 Mechanic St
- 46 Berwick Rd
- 18-20 Jefferson St
- 37 Holman St
- 28 Pine St Unit C
- 21 4th St
- 45 Holman St
- 75 Dennis St Unit 3
- 40 Flora Rd
- 19 Quincy Way
Your Personal Tour Guide
Ask me questions while you tour the home.