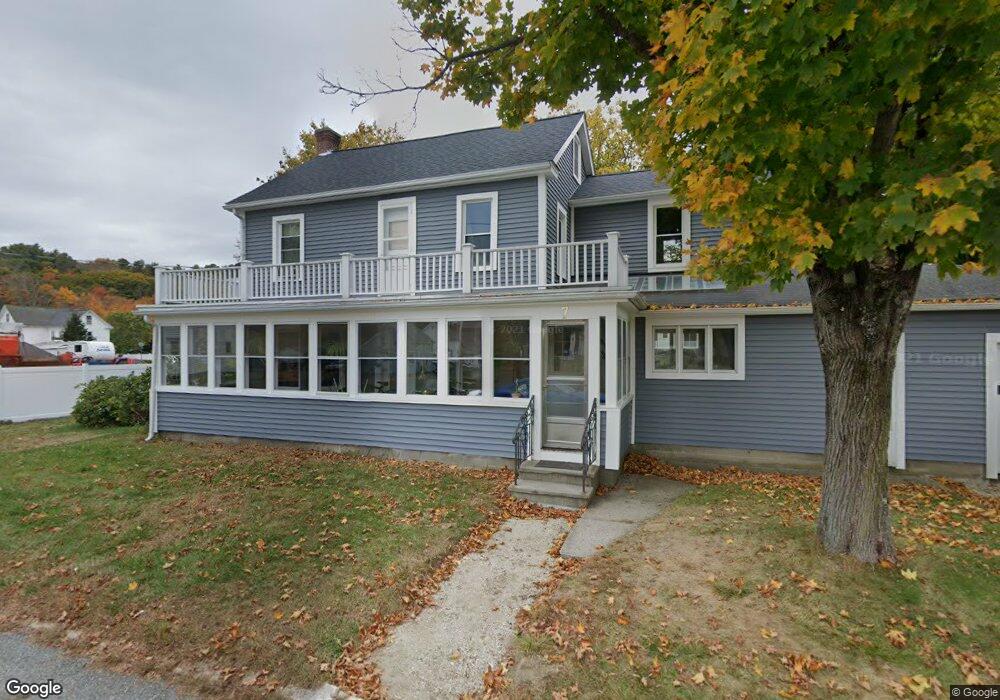
7 Jarvis St Sutton, MA 01590
Estimated Value: $438,062 - $538,000
4
Beds
3
Baths
1,882
Sq Ft
$256/Sq Ft
Est. Value
About This Home
This home is located at 7 Jarvis St, Sutton, MA 01590 and is currently estimated at $482,516, approximately $256 per square foot. 7 Jarvis St is a home located in Worcester County with nearby schools including Sutton Elementary School, Sutton Middle School, and Sutton High School.
Ownership History
Date
Name
Owned For
Owner Type
Purchase Details
Closed on
Oct 1, 2020
Sold by
Gosnell James H
Bought by
Parker Paul R and Newton Kelsey
Current Estimated Value
Home Financials for this Owner
Home Financials are based on the most recent Mortgage that was taken out on this home.
Original Mortgage
$332,500
Outstanding Balance
$295,741
Interest Rate
2.9%
Mortgage Type
New Conventional
Estimated Equity
$186,775
Purchase Details
Closed on
Oct 31, 2018
Sold by
Gosnell James H and Cahill-Gosnell Sue
Bought by
Gosnell James H
Purchase Details
Closed on
Feb 12, 1986
Bought by
Gosnell James H and Gosnell Sue Cahill
Create a Home Valuation Report for This Property
The Home Valuation Report is an in-depth analysis detailing your home's value as well as a comparison with similar homes in the area
Home Values in the Area
Average Home Value in this Area
Purchase History
| Date | Buyer | Sale Price | Title Company |
|---|---|---|---|
| Parker Paul R | $350,000 | None Available | |
| Gosnell James H | -- | -- | |
| Gosnell James H | $90,000 | -- |
Source: Public Records
Mortgage History
| Date | Status | Borrower | Loan Amount |
|---|---|---|---|
| Open | Parker Paul R | $332,500 |
Source: Public Records
Tax History
| Year | Tax Paid | Tax Assessment Tax Assessment Total Assessment is a certain percentage of the fair market value that is determined by local assessors to be the total taxable value of land and additions on the property. | Land | Improvement |
|---|---|---|---|---|
| 2025 | $5,114 | $384,500 | $146,300 | $238,200 |
| 2024 | $5,185 | $375,200 | $140,000 | $235,200 |
| 2023 | $5,413 | $359,200 | $126,500 | $232,700 |
| 2022 | $4,913 | $296,700 | $101,200 | $195,500 |
| 2021 | $4,675 | $266,700 | $101,200 | $165,500 |
| 2020 | $4,428 | $256,700 | $101,200 | $155,500 |
| 2019 | $4,164 | $235,900 | $97,300 | $138,600 |
| 2018 | $3,779 | $213,000 | $82,700 | $130,300 |
| 2017 | $3,645 | $205,100 | $71,500 | $133,600 |
| 2016 | $3,677 | $205,100 | $71,500 | $133,600 |
| 2015 | $3,563 | $198,400 | $71,500 | $126,900 |
| 2014 | $3,509 | $192,800 | $69,400 | $123,400 |
Source: Public Records
Map
Nearby Homes
Your Personal Tour Guide
Ask me questions while you tour the home.