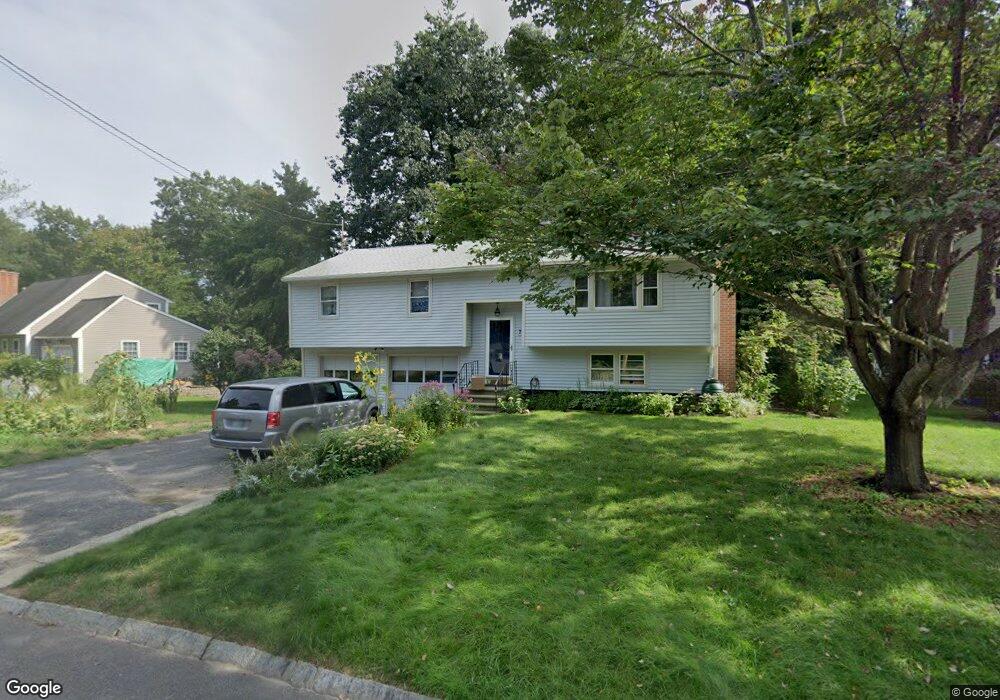
7 Margaret Cir Nashua, NH 03062
Southwest Nashua NeighborhoodEstimated Value: $568,000 - $609,000
3
Beds
3
Baths
1,236
Sq Ft
$478/Sq Ft
Est. Value
About This Home
This home is located at 7 Margaret Cir, Nashua, NH 03062 and is currently estimated at $590,951, approximately $478 per square foot. 7 Margaret Cir is a home located in Hillsborough County with nearby schools including Main Dunstable School, Elm Street Middle School, and Nashua High School South.
Ownership History
Date
Name
Owned For
Owner Type
Purchase Details
Closed on
Sep 13, 2019
Sold by
Anne E Cacciola Ret and Cacciola
Bought by
Smith Jason and Fortier Jessica
Current Estimated Value
Home Financials for this Owner
Home Financials are based on the most recent Mortgage that was taken out on this home.
Original Mortgage
$350,550
Outstanding Balance
$307,682
Interest Rate
3.7%
Mortgage Type
New Conventional
Estimated Equity
$283,269
Purchase Details
Closed on
Feb 6, 1997
Sold by
Timmel Paul J and Timmel Patricia M
Bought by
Fuller David E and Fuller Rebecca S
Home Financials for this Owner
Home Financials are based on the most recent Mortgage that was taken out on this home.
Original Mortgage
$108,375
Interest Rate
7.57%
Mortgage Type
Purchase Money Mortgage
Create a Home Valuation Report for This Property
The Home Valuation Report is an in-depth analysis detailing your home's value as well as a comparison with similar homes in the area
Home Values in the Area
Average Home Value in this Area
Purchase History
| Date | Buyer | Sale Price | Title Company |
|---|---|---|---|
| Smith Jason | $369,000 | -- | |
| Fuller David E | $127,500 | -- |
Source: Public Records
Mortgage History
| Date | Status | Borrower | Loan Amount |
|---|---|---|---|
| Open | Smith Jason | $350,550 | |
| Previous Owner | Fuller David E | $144,000 | |
| Previous Owner | Fuller David E | $95,000 | |
| Previous Owner | Fuller David E | $212,000 | |
| Previous Owner | Fuller David E | $108,375 |
Source: Public Records
Tax History Compared to Growth
Tax History
| Year | Tax Paid | Tax Assessment Tax Assessment Total Assessment is a certain percentage of the fair market value that is determined by local assessors to be the total taxable value of land and additions on the property. | Land | Improvement |
|---|---|---|---|---|
| 2024 | $8,559 | $538,300 | $170,600 | $367,700 |
| 2023 | $8,220 | $450,900 | $136,500 | $314,400 |
| 2022 | $8,148 | $450,900 | $136,500 | $314,400 |
| 2021 | $7,468 | $321,600 | $95,500 | $226,100 |
| 2020 | $6,871 | $303,900 | $95,500 | $208,400 |
| 2019 | $6,613 | $303,900 | $95,500 | $208,400 |
| 2018 | $5,946 | $303,900 | $95,500 | $208,400 |
| 2017 | $6,546 | $253,800 | $74,000 | $179,800 |
| 2016 | $6,363 | $253,800 | $74,000 | $179,800 |
| 2015 | $6,226 | $253,800 | $74,000 | $179,800 |
| 2014 | $6,104 | $253,800 | $74,000 | $179,800 |
Source: Public Records
Map
Nearby Homes
- 5 Wilderness Dr
- 15 Westray Dr
- 31 Tenby Dr
- 188 Harris Rd
- 375 Main Dunstable Rd
- 57 Wethersfield Rd
- 33 Cannon Dr
- 25 Cortez Dr Unit U57
- 61 Wilderness Dr
- 59 Wilderness Dr
- 7 Doucet Ave
- 7 Wilderness Dr
- 6 Wilderness Dr
- 57 Wilderness Dr
- 3 Wilderness Dr
- 4 Hikers Ln
- 79 Wilderness Dr
- 8 Hikers Ln
- 2 Wilderness Dr
- 4 Wilderness Dr